Advertisements
Advertisements
प्रश्न
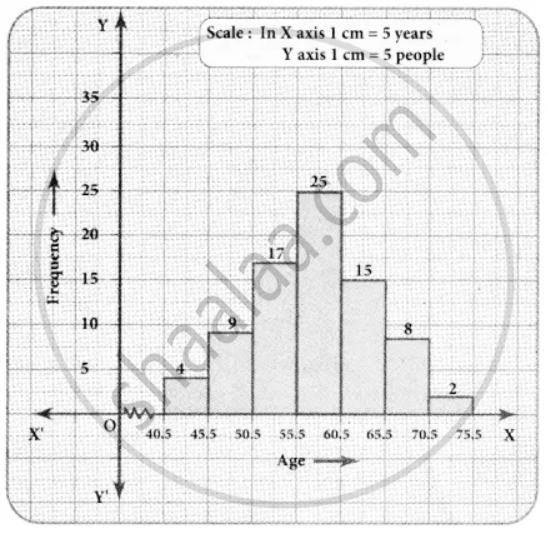
Draw a histogram for the given frequency distribution
| Age | 41 − 45 | 46 − 50 | 51 − 55 | 56 − 60 | 61 − 65 | 66 − 70 | 71 − 75 |
| Frequency | 4 | 9 | 17 | 25 | 15 | 8 | 2 |
Advertisements
उत्तर
The given distribution is discontinuous.
Lower boundary = lower limit – `1/2` (gap between the adjacent class interval)
= `41 - 1/2` (1) = 40.5
Upper boundary = Upper limit + `1/2` (gap between the adjacent class interval)
= `45 + 1/2` (1) = 45.5
Now continuous frequency table is as below
| Age | 40.5 − 45.5 | 45.5 − 50.5 | 50.5 − 55.5 | 55.5 − 60.5 | 60.5 − 65.5 | 65.5 − 70.5 | 70.5 − 75.5 |
| Frequency | 4 | 9 | 17 | 25 | 15 | 8 | 2 |
APPEARS IN
संबंधित प्रश्न
Draw histogram for the following frequency distributions:
| Class Interval | 10 – 16 | 16 – 22 | 22 – 28 | 28 – 34 | 34 – 40 |
| Frequency | 15 | 23 | 30 | 20 | 16 |
Draw histogram for the following frequency distributions:
| Class Interval | 30 – 39 | 40 – 49 | 50 – 59 | 60 – 69 | 70 – 79 |
| Frequency | 24 | 16 | 09 | 15 | 20 |
Time alloted for the preparation of an examination by some students is shown in the table. Draw a histogram to show the information.
| Time (minutes) | 60 - 80 | 80 - 100 | 100 - 120 | 120 - 140 | 140 - 160 |
| No. of students | 14 | 20 | 24 | 22 | 16 |
Given below is the frequency distribution of the heights of 50 students of a class:
| Class interval: | 140−145 | 145−150 | 150−155 | 155−160 | 160−165 |
| Frequency: | 8 | 12 | 18 | 10 | 5 |
Draw a histogram representing the above data.
Construct a histogram for the following data:
| Monthly school fee (in Rs): | 30−60 | 60−90 | 90−120 | 120−150 | 150−180 | 180−210 | 210−240 |
| Number of schools: | 5 | 12 | 14 | 18 | 10 | 9 | 4 |
Construct histograms for following frequency distribution:
| Class Mark | 15 | 25 | 35 | 45 | 50 | 55 | 60 |
| Frenuencv | 6 | 12 | 15 | 18 | 25 | 14 | 10 |
Construct a frequency polygon without using a histogram for the following frequency distribution :
| Class Mark | 10 | 15 | 20 | 25 | 30 | 35 | 40 |
| Frequency | 4 | 20 | 40 | 45 | 30 | 25 | 5 |
From the histogram given on the right, we can say that 1500 males above the age of 20 are literate.

Look at the histogram below and answer the questions that follow.

- How many students have height more than or equal to 135 cm but less than 150 cm?
- Which class interval has the least number of students?
- What is the class size?
- How many students have height less than 140 cm?
The below histogram shows the number of literate females in the age group of 10 to 40 years in a town.

- Write the classes assuming all the classes are of equal width.
- What is the classes width?
- In which age group are literate females the least?
- In which age group is the number of literate females the highest?
