Advertisements
Advertisements
प्रश्न
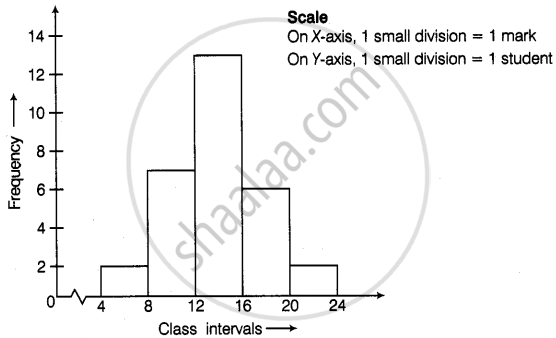
Prepare a histogram from the frequency distribution table obtained in question 93.
Advertisements
उत्तर
APPEARS IN
संबंधित प्रश्न
Draw the frequency polygon for the following frequency distribution
| Rainfall (in cm) | No. of Years |
| 20 — 25 | 2 |
| 25 — 30 | 5 |
| 30 — 35 | 8 |
| 35 — 40 | 12 |
| 40 — 45 | 10 |
| 45 — 50 | 7 |
The following is the frequency distribution of waiting time at ATM centre; draw histogram to represent the data:
| Waiting time (in seconds) |
Number of Customers |
| 0 -30 | 15 |
| 30 - 60 | 23 |
| 60 - 90 | 64 |
| 90 - 120 | 50 |
| 120 - 150 | 5 |
A Mathematics aptitude test of 50 students was recorded as follows:
| Marks | 50 - 60 | 60 - 70 | 70 - 80 | 80 - 90 | 90 – 100 |
| No. of Students | 4 | 8 | 14 | 19 | 5 |
Draw a histogram from the above data using a graph paper and locate the mode.
Draw histogram for the following frequency distributions:
| Class Interval | 0 – 10 | 10 – 20 | 20 – 30 | 30 – 40 | 40 – 50 | 50 – 60 |
| Frequency | 12 | 20 | 26 | 18 | 10 | 6 |
Draw a histogram of the following data.
| Height of student (cm) | 135 - 140 | 140 - 145 | 145 - 150 | 150 - 155 |
| No. of students | 4 | 12 | 16 | 8 |
The table below shows the yield of jowar per acre. Show the data by histogram.
| Yield per acre (quintal) | 2 - 3 | 4 - 5 | 6 - 7 | 8 - 9 | 10 - 11 |
| No. of farmers | 30 | 50 | 55 | 40 | 20 |
Observe the following frequency polygon and write the answers of the questions below it.
- Which class has the maximum number of students?
- Write the classes having zero frequency.
- What is the class-mark of the class, having frequency of 50 students?
- Write the lower and upper class limits of the class whose class mark is 85.
- How many students are in the class 80-90?
Find the correct answer from the alternatives given.
|
No. of trees planted by each student |
1 - 3 | 4 - 6 | 7 - 9 | 10 - 12 |
| No. of students | 7 | 8 | 6 | 4 |
The above data is to be shown by a frequency polygon. The coordinates of the points to show number of students in the class 4-6 are . . . .
In a hypothetical sample of 20 people the amounts of money with them were found to be as follows:
114, 108, 100, 98, 101, 109, 117, 119, 126, 131, 136, 143, 156, 169, 182, 195, 207, 219, 235, 118.
Draw the histogram of the frequency distribution (taking one of the class intervals as 50 − 100).
Draw a histogram to represent the following data:
| Monthly salary (in Rs) | Number of teachers |
| 5600−5700 | 8 |
| 5700−5800 | 4 |
| 5800−5900 | 3 |
| 5900−6000 | 5 |
| 6000−6100 | 2 |
| 6100−6200 | 3 |
| 6200−6300 | 1 |
| 6300−6400 | 2 |
Construct histograms for following frequency distribution:
| Class Mark | 15 | 25 | 35 | 45 | 50 | 55 | 60 |
| Frenuencv | 6 | 12 | 15 | 18 | 25 | 14 | 10 |
Construct a frequency polygon without using a histogram for the following frequency distribution :
| Class Interval | 10-20 | 20-40 | 40-60 | 60-80 | 80-100 |
| Frequency | 9 | 17 | 15 | 20 | 14 |
The marks scored by students in Mathematics in a certain examination are given below :
| Marks Scored | Number of Students |
| 0 - 20 | 6 |
| 20 - 40 | 9 |
| 40 - 60 | 14 |
| 60 - 80 | 16 |
| 80 - 100 | 5 |
Draw histogram for the above data.
Draw the histogram for the following frequency distribution and hence estimate the mode for the distribution.
| Class | Frequency |
| 0 - 5 | 2 |
| 5 - 10 | 7 |
| 10 - 15 | 18 |
| 15 - 20 | 10 |
| 20 - 25 | 8 |
| 25 - 30 | 5 |
| Total | 24 |
Try yourself
- Next time when you watch your favourite TV programme, count the number of advertisements during each break. Use tally marks. Put a dot below the tally when you find children in any advertisement.
- Compare with your friends. Do you get different answers?
In a histogram, class intervals and frequencies are taken along ______ axis and ______ axis.
From the histogram given on the right, we can say that 1500 males above the age of 20 are literate.

The following pictorial representation of data is a histogram.

Look at the histogram below and answer the questions that follow.

- How many students have height more than or equal to 135 cm but less than 150 cm?
- Which class interval has the least number of students?
- What is the class size?
- How many students have height less than 140 cm?
The table given below shows the runs scored by a cricket team during the overs of a match.
| Overs | Runs scored |
| 20 – 30 | 37 |
| 30 – 40 | 45 |
| 40 – 50 | 40 |
| 50 – 60 | 60 |
| 60 – 70 | 51 |
| 70 – 80 | 35 |
Use graph sheet for this question.
Take 2 cm = 10 overs along one axis and 2 cm = 10 runs along the other axis.
- Draw a histogram representing the above distribution.
- Estimate the modal runs scored.
