Advertisements
Advertisements
प्रश्न
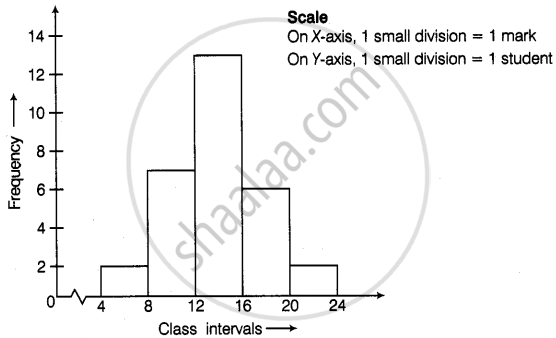
Prepare a histogram from the frequency distribution table obtained in question 93.
Advertisements
उत्तर
APPEARS IN
संबंधित प्रश्न
The marks scored by students in Mathematics in a certain Examination are given below:
| Marks Scored | Number of Students |
| 0 — 20 | 3 |
| 20 — 40 | 8 |
| 40 — 60 | 19 |
| 60 — 80 | 18 |
| 80 — 100 | 6 |
Draw histogram for the above data.
The following is the frequency distribution of waiting time at ATM centre; draw histogram to represent the data:
| Waiting time (in seconds) |
Number of Customers |
| 0 -30 | 15 |
| 30 - 60 | 23 |
| 60 - 90 | 64 |
| 90 - 120 | 50 |
| 120 - 150 | 5 |
Draw histogram and frequency polygon on the same graph paper for the following frequency distribution
| Class | Frequency |
| 15-20 | 20 |
| 20-25 | 30 |
| 25-30 | 50 |
| 30-35 | 40 |
| 35-40 | 25 |
| 40-45 | 10 |
The histogram below represents the scores obtained by 25 students in a mathematics mental test. Use the data to:
- Frame a frequency distribution table.
- To calculate mean.
- To determine the Modal class.

The age groups and the number of persons in the age groups, who donated blood in blood donation camp is given below. Find the measures of central angles to show the information by a pie diagram.
| Age group (Years) | 20-25 | 25-30 | 30-35 | 35-40 |
| No of persons | 80 | 60 | 35 | 25 |
Given below is the frequency distribution of the heights of 50 students of a class:
| Class interval: | 140−145 | 145−150 | 150−155 | 155−160 | 160−165 |
| Frequency: | 8 | 12 | 18 | 10 | 5 |
Draw a histogram representing the above data.
In a hypothetical sample of 20 people the amounts of money with them were found to be as follows:
114, 108, 100, 98, 101, 109, 117, 119, 126, 131, 136, 143, 156, 169, 182, 195, 207, 219, 235, 118.
Draw the histogram of the frequency distribution (taking one of the class intervals as 50 − 100).
Construct histograms for following frequency distribution:
| Class Interval | 130-140 | 140-150 | 150-160 | 160-170 | 170-180 |
| Frequency | 24 | 16 | 29 | 20 | 11 |
Distribution of height in cm of 100 people is given below:
| Class interval (cm) | Frequency |
| 145 - 155 | 3 |
| 155 - 165 | 35 |
| 165 - 175 | 25 |
| 175 - 185 | 15 |
| 185 - 195 | 20 |
| 195 - 205 | 2 |
Draw a histogram to represent the above data.
Draw a histogram and frequency polygon to represent the following data (on the same scale) which shows the monthly cost of living index of a city in a period of 2 years:
| Cost of living Index | Number of months |
| 440 - 460 | 2 |
| 460 - 480 | 4 |
| 480 - 500 | 3 |
| 500 - 520 | 5 |
| 520 - 540 | 3 |
| 540 - 560 | 2 |
| 560 - 580 | 1 |
| 580 - 600 | 4 |
| Total | 24 |
Draw the histogram for the following frequency distribution and hence estimate the mode for the distribution.
| Class | Frequency |
| 0 - 5 | 2 |
| 5 - 10 | 7 |
| 10 - 15 | 18 |
| 15 - 20 | 10 |
| 20 - 25 | 8 |
| 25 - 30 | 5 |
| Total | 24 |
(Use a graph paper for this question.) The daily pocket expenses of 200 students in a school are given below:
| Pocket expenses (in ₹) |
Number of students (frequency) |
| 0 - 5 | 10 |
| 5 - 10 | 14 |
| 10 - 15 | 28 |
| 15 - 20 | 42 |
| 20 - 25 | 50 |
| 25 - 30 | 30 |
| 30 - 35 | 14 |
| 35 - 40 | 12 |
Draw a histogram representing the above distribution and estimate the mode from the graph.
Identify the following data can be represented in a histogram?
Production of cycles in different years
The total area of the histogram is _________ to the total frequency of the given data
Construct a histogram from the following distribution of total marks of 40 students in a class.
| Marks | 90 − 110 | 110 − 130 | 130 − 150 | 150 − 170 | 170 − 190 | 190 − 210 |
| No. of Students | 9 | 5 | 10 | 7 | 4 | 6 |
In a histogram, class intervals and frequencies are taken along ______ axis and ______ axis.
From the histogram given on the right, we can say that 1500 males above the age of 20 are literate.

Look at the histogram below and answer the questions that follow.

- How many students have height more than or equal to 135 cm but less than 150 cm?
- Which class interval has the least number of students?
- What is the class size?
- How many students have height less than 140 cm?
The following histogram shows the frequency distribution of teaching experiences of 30 teachers in various schools:

- What is the class width?
- How many teachers are having the maximum teaching experience and how many have the least teaching experience?
- How many teachers have teaching experience of 10 to 20 years?
