Advertisements
Advertisements
प्रश्न
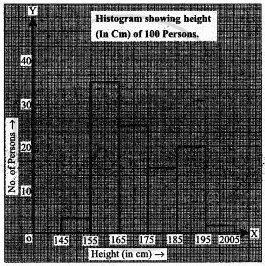
Distribution of height in cm of 100 people is given below:
| Class interval (cm) | Frequency |
| 145 - 155 | 3 |
| 155 - 165 | 35 |
| 165 - 175 | 25 |
| 175 - 185 | 15 |
| 185 - 195 | 20 |
| 195 - 205 | 2 |
Draw a histogram to represent the above data.
Advertisements
उत्तर
संबंधित प्रश्न
Draw a histogram of the following data.
| Height of student (cm) | 135 - 140 | 140 - 145 | 145 - 150 | 150 - 155 |
| No. of students | 4 | 12 | 16 | 8 |
Find the lower quartile, the upper quartile, the interquartile range and the semi-interquartile range for the following frequency distributions:
| Variate | 10 | 11 | 12 | 13 | 14 | 15 | 16 | 17 | 18 | 19 | 20 |
| Frequency | 1 | 2 | 3 | 1 | 2 | 4 | 2 | 1 | 1 | 2 | 1 |
Construct histograms for following frequency distribution:
| Class Interval | 110-119 | 120-129 | 130-139 | 140-149 | 150-159 |
| Frequency | 15 | 23 | 30 | 20 | 16 |
Construct histograms for following frequency distribution:
| Class Interval | 130-140 | 140-150 | 150-160 | 160-170 | 170-180 |
| Frequency | 24 | 16 | 29 | 20 | 11 |
Draw histogram and hence the frequency polygon for the following frequency distribution:
| Rainfall (in cm) | No. of years |
| 20-25 | 2 |
| 25-30 | 5 |
| 30-35 | 8 |
| 35-40 | 12 |
| 40-45 | 10 |
| 45-50 | 7 |
The total area of the histogram is _________ to the total frequency of the given data
Construct a histogram from the following distribution of total marks of 40 students in a class.
| Marks | 90 − 110 | 110 − 130 | 130 − 150 | 150 − 170 | 170 − 190 | 190 − 210 |
| No. of Students | 9 | 5 | 10 | 7 | 4 | 6 |
The height of a rectangle in a histogram shows the ______.
In a histogram ______ are drawn with width equal to a class interval without leaving any gap in between.
Prepare a histogram from the frequency distribution table obtained in question 93.
