Advertisements
Advertisements
Question
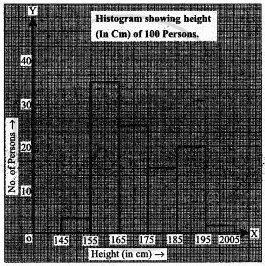
Distribution of height in cm of 100 people is given below:
| Class interval (cm) | Frequency |
| 145 - 155 | 3 |
| 155 - 165 | 35 |
| 165 - 175 | 25 |
| 175 - 185 | 15 |
| 185 - 195 | 20 |
| 195 - 205 | 2 |
Draw a histogram to represent the above data.
Advertisements
Solution
RELATED QUESTIONS
Draw the frequency polygon for the following frequency distribution
| Rainfall (in cm) | No. of Years |
| 20 — 25 | 2 |
| 25 — 30 | 5 |
| 30 — 35 | 8 |
| 35 — 40 | 12 |
| 40 — 45 | 10 |
| 45 — 50 | 7 |
The number of hours for which students of a particular class watched television during holidays is shown through the given graph.
Answer the following
1) For how many hours did the maximum number of students watch TV?
2) How many students watched TV for less than 4 hours?
3) How many students spent more than 5 hours in watching TV?

| Result (Percentage) | 30 - 40 | 40 - 50 | 50 - 60 | 60 -70 | 70 - 80 | 80 - 90 | 90 - 100 |
| No. of students | 7 | 33 | 45 | 65 | 47 | 18 | 5 |
Construct histograms for following frequency distribution:
| Class Interval | 1-10 | 11-20 | 21-30 | 31-40 | 41-50 |
| Frequency | 11 | 23 | 30 | 20 | 16 |
Construct a frequency polygon without using a histogram for the following frequency distribution :
| Class Interval | 10-20 | 20-40 | 40-60 | 60-80 | 80-100 |
| Frequency | 9 | 17 | 15 | 20 | 14 |
(Use a graph paper for this question.) The daily pocket expenses of 200 students in a school are given below:
| Pocket expenses (in ₹) |
Number of students (frequency) |
| 0 - 5 | 10 |
| 5 - 10 | 14 |
| 10 - 15 | 28 |
| 15 - 20 | 42 |
| 20 - 25 | 50 |
| 25 - 30 | 30 |
| 30 - 35 | 14 |
| 35 - 40 | 12 |
Draw a histogram representing the above distribution and estimate the mode from the graph.
Histogram is a graph of a ________ frequency distribution
The graphical representation of grouped data is _________
Histogram shows the number of people owning the different number of books. Answer the question based on it.

The number of people having books more than 20 and less than 40 is ______.
The following pictorial representation of data is a histogram.

