Advertisements
Advertisements
प्रश्न
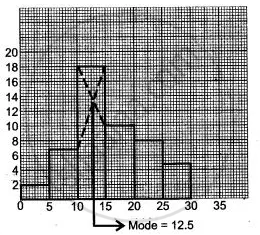
Draw the histogram for the following frequency distribution and hence estimate the mode for the distribution.
| Class | Frequency |
| 0 - 5 | 2 |
| 5 - 10 | 7 |
| 10 - 15 | 18 |
| 15 - 20 | 10 |
| 20 - 25 | 8 |
| 25 - 30 | 5 |
| Total | 24 |
Advertisements
उत्तर
संबंधित प्रश्न
Draw histogram and frequency polygon on the same graph paper for the following frequency distribution
| Class | Frequency |
| 15-20 | 20 |
| 20-25 | 30 |
| 25-30 | 50 |
| 30-35 | 40 |
| 35-40 | 25 |
| 40-45 | 10 |
A Mathematics aptitude test of 50 students was recorded as follows:
| Marks | 50 - 60 | 60 - 70 | 70 - 80 | 80 - 90 | 90 – 100 |
| No. of Students | 4 | 8 | 14 | 19 | 5 |
Draw a histogram from the above data using a graph paper and locate the mode.
Draw histogram for the following frequency distributions:
| Class Interval | 0 – 10 | 10 – 20 | 20 – 30 | 30 – 40 | 40 – 50 | 50 – 60 |
| Frequency | 12 | 20 | 26 | 18 | 10 | 6 |
Draw histogram for the following frequency distributions:
| Class Interval | 30 – 39 | 40 – 49 | 50 – 59 | 60 – 69 | 70 – 79 |
| Frequency | 24 | 16 | 09 | 15 | 20 |
Draw a histogram for the daily earnings of 30 drug stores in the following table:
| Daily earnings (in Rs): | 450−500 | 500−550 | 550−600 | 600−650 | 650−700 |
| Numbers of stores: | 16 | 10 | 7 | 3 | 1 |
The total area of the histogram is _________ to the total frequency of the given data
Construct a histogram from the following distribution of total marks of 40 students in a class.
| Marks | 90 − 110 | 110 − 130 | 130 − 150 | 150 − 170 | 170 − 190 | 190 − 210 |
| No. of Students | 9 | 5 | 10 | 7 | 4 | 6 |
The height of a rectangle in a histogram shows the ______.
Histogram shows the number of people owning the different number of books. Answer the question based on it.

The number of people owning books more than 60 is ______.
In a histogram, class intervals and frequencies are taken along ______ axis and ______ axis.
