Advertisements
Advertisements
प्रश्न
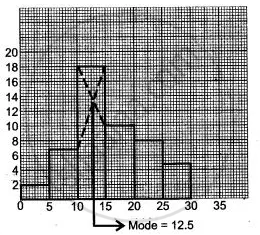
Draw the histogram for the following frequency distribution and hence estimate the mode for the distribution.
| Class | Frequency |
| 0 - 5 | 2 |
| 5 - 10 | 7 |
| 10 - 15 | 18 |
| 15 - 20 | 10 |
| 20 - 25 | 8 |
| 25 - 30 | 5 |
| Total | 24 |
Advertisements
उत्तर
संबंधित प्रश्न
Draw histogram for the following frequency distributions:
| Class Interval | 0 – 10 | 10 – 20 | 20 – 30 | 30 – 40 | 40 – 50 | 50 – 60 |
| Frequency | 12 | 20 | 26 | 18 | 10 | 6 |
Draw histogram for the following frequency distributions:
| Class Interval | 30 – 39 | 40 – 49 | 50 – 59 | 60 – 69 | 70 – 79 |
| Frequency | 24 | 16 | 09 | 15 | 20 |
Draw a histogram of the following data:
| Class interval: | 10−15 | 15−20 | 20−25 | 25−30 | 30−35 | 34−40 |
| Frequency: | 30 | 98 | 80 | 58 | 29 | 50 |
The following histogram shows the number of literate females in the age group of 10 to 40 years in a town:
(i) Write the age group in which the number of literate female is the highest.
(ii) What is the class width?
(iii) What is the lowest frequency?
(iv) What are the class marks of the classes?
(v) In which age group literate females are the least?
Identify the following data can be represented in a histogram?
The number of mountain climbers in the age group 20 to 60 in Tamil Nadu.
Construct a histogram from the following distribution of total marks of 40 students in a class.
| Marks | 90 − 110 | 110 − 130 | 130 − 150 | 150 − 170 | 170 − 190 | 190 − 210 |
| No. of Students | 9 | 5 | 10 | 7 | 4 | 6 |
Histogram shows the number of people owning the different number of books. Answer the question based on it.

The number of people owning books less than 40 is ______.
In a histogram ______ are drawn with width equal to a class interval without leaving any gap in between.
The following histogram shows the frequency distribution of teaching experiences of 30 teachers in various schools:

- What is the class width?
- How many teachers are having the maximum teaching experience and how many have the least teaching experience?
- How many teachers have teaching experience of 10 to 20 years?
Show the following data by a frequency polygon:
| Electricity bill (₹) | Families |
| 200 – 400 | 240 |
| 400 – 600 | 300 |
| 600 – 800 | 450 |
| 800 – 1000 | 350 |
| 1000 – 1200 | 160 |
