Advertisements
Advertisements
Question
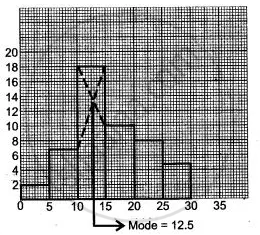
Draw the histogram for the following frequency distribution and hence estimate the mode for the distribution.
| Class | Frequency |
| 0 - 5 | 2 |
| 5 - 10 | 7 |
| 10 - 15 | 18 |
| 15 - 20 | 10 |
| 20 - 25 | 8 |
| 25 - 30 | 5 |
| Total | 24 |
Advertisements
Solution
RELATED QUESTIONS
The following is the frequency distribution of waiting time at ATM centre; draw histogram to represent the data:
| Waiting time (in seconds) |
Number of Customers |
| 0 -30 | 15 |
| 30 - 60 | 23 |
| 60 - 90 | 64 |
| 90 - 120 | 50 |
| 120 - 150 | 5 |
Number of workshops organized by a school in different areas during the last five years are as follows:
| Years | No. of workshops |
| 1995−1996 | 25 |
| 1996−1997 | 30 |
| 1997−1998 | 42 |
| 1998−1999 | 50 |
| 1999−2000 | 65 |
Draw a histogram representing the above data.
Represent the following data by histogram:
| Price of sugar Per kg (in Rs) | Number of weeks |
| 28-30 | 4 |
| 30-32 | 8 |
| 32-34 | 22 |
| 34-36 | 12 |
| 36-38 | 6 |
The marks obtained by 50 students in Mathematics are given below.
(i) Make a frequency distribution table taking a class size of 10 marks
(ii) Draw a histogram and a frequency polygon.
| 52 | 33 | 56 | 52 | 44 | 59 | 47 | 61 | 49 | 61 |
| 47 | 52 | 67 | 39 | 89 | 57 | 64 | 58 | 63 | 65 |
| 32 | 64 | 50 | 54 | 42 | 48 | 22 | 37 | 59 | 63 |
| 36 | 35 | 48 | 48 | 55 | 62 | 74 | 43 | 41 | 51 |
| 08 | 71 | 30 | 18 | 43 | 28 | 20 | 40 | 58 | 49 |
The graphical representation of grouped data is _________
Histogram shows the number of people owning the different number of books. Answer the question based on it.

The number of people having books more than 20 and less than 40 is ______.
In a histogram ______ are drawn with width equal to a class interval without leaving any gap in between.
Draw a histogram for the following data.
| Class interval | 10 – 15 | 15 – 20 | 20 – 25 | 25 – 30 | 30 – 35 | 35 – 40 |
| Frequency | 30 | 98 | 80 | 58 | 29 | 50 |
Use graph paper for this question. Estimate the mode of the given distribution by plotting a histogram. [Take 2 cm = 10 marks along one axis and 2 cm = 5 students along the other axis]
| Daily wages (in ₹) | 30 - 40 | 40 - 50 | 50 - 60 | 60 - 70 | 70 - 80 |
| No. of Workers | 6 | 12 | 20 | 15 | 9 |
The table given below shows the runs scored by a cricket team during the overs of a match.
| Overs | Runs scored |
| 20 – 30 | 37 |
| 30 – 40 | 45 |
| 40 – 50 | 40 |
| 50 – 60 | 60 |
| 60 – 70 | 51 |
| 70 – 80 | 35 |
Use graph sheet for this question.
Take 2 cm = 10 overs along one axis and 2 cm = 10 runs along the other axis.
- Draw a histogram representing the above distribution.
- Estimate the modal runs scored.
