Advertisements
Advertisements
प्रश्न
A Mathematics aptitude test of 50 students was recorded as follows:
| Marks | 50 - 60 | 60 - 70 | 70 - 80 | 80 - 90 | 90 – 100 |
| No. of Students | 4 | 8 | 14 | 19 | 5 |
Draw a histogram from the above data using a graph paper and locate the mode.
Advertisements
उत्तर
The histogram for the given data can be drawn by taking the marks on the x-axis and the number of students on the y-axis.
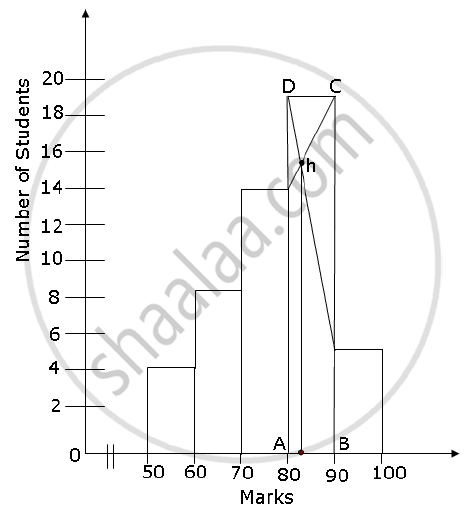
To locate the mode from the histogram, we proceed as follows:
1) Find the modal class. Rectangle ABCD is the largest rectangle. It represents the modal class, that is, the mode lies in this rectangle. The modal class is 80 – 90.
2) Draw two lines diagonally from the vertices C and D to the upper corners of the two adjacent rectangles. Let these rectangles intersect at point H.
3) The x-value of the point H is the mode. Thus, mode of the given data is approximately 83.
APPEARS IN
संबंधित प्रश्न
Represent the following data by Histogram:
|
Price of Sugar per kg (in Rs.) |
Number of Weeks |
| 18-20 | 4 |
| 20-22 | 8 |
| 22-24 | 22 |
| 24-26 | 12 |
| 26-28 | 8 |
| 28-30 | 6 |
| Result (Percentage) | 30 - 40 | 40 - 50 | 50 - 60 | 60 -70 | 70 - 80 | 80 - 90 | 90 - 100 |
| No. of students | 7 | 33 | 45 | 65 | 47 | 18 | 5 |
The following table is based on the marks of the first term examination of 10th class students. Show the information by a histogram. Also, draw a frequency polygon with the help of the histogram.
| Class-mark of marks | 325 | 375 | 425 | 475 | 525 | 575 |
| No. of students | 25 | 35 | 45 | 40 | 32 | 20 |
Draw a histogram of the following data:
| Class interval: | 10−15 | 15−20 | 20−25 | 25−30 | 30−35 | 34−40 |
| Frequency: | 30 | 98 | 80 | 58 | 29 | 50 |
Construct histograms for following frequency distribution:
| Class Interval | 0-10 | 10-20 | 20-30 | 30-40 | 40-50 | 50-60 |
| Frequency | 8 | 20 | 34 | 22 | 10 | 6 |
Construct histograms for following frequency distribution:
| Class Interval | 1-10 | 11-20 | 21-30 | 31-40 | 41-50 |
| Frequency | 11 | 23 | 30 | 20 | 16 |
Draw histogram and hence the frequency polygon for the following frequency distribution:
| Rainfall (in cm) | No. of years |
| 20-25 | 2 |
| 25-30 | 5 |
| 30-35 | 8 |
| 35-40 | 12 |
| 40-45 | 10 |
| 45-50 | 7 |
Histogram shows the number of people owning the different number of books. Answer the question based on it.

The number of people owning books less than 40 is ______.
Use graph paper for this question. Estimate the mode of the given distribution by plotting a histogram. [Take 2 cm = 10 marks along one axis and 2 cm = 5 students along the other axis]
| Daily wages (in ₹) | 30 - 40 | 40 - 50 | 50 - 60 | 60 - 70 | 70 - 80 |
| No. of Workers | 6 | 12 | 20 | 15 | 9 |
The table given below shows the runs scored by a cricket team during the overs of a match.
| Overs | Runs scored |
| 20 – 30 | 37 |
| 30 – 40 | 45 |
| 40 – 50 | 40 |
| 50 – 60 | 60 |
| 60 – 70 | 51 |
| 70 – 80 | 35 |
Use graph sheet for this question.
Take 2 cm = 10 overs along one axis and 2 cm = 10 runs along the other axis.
- Draw a histogram representing the above distribution.
- Estimate the modal runs scored.
