Advertisements
Advertisements
प्रश्न
Figure given below shows a velocity-time graph for a car starting from rest. The graph has three parts AB, BC and CD.
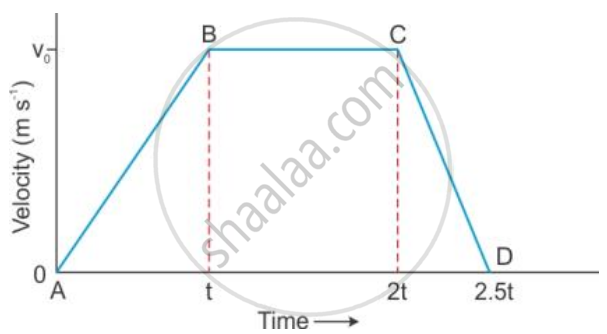
(a) Is the magnitude of acceleration higher or lower than that of retardation ? Give a reason .
(b) Compare the magnitude of acceleration and retardation .
Advertisements
उत्तर
(a) The magnitude of acceleration is lower as the slope of line AB is less than that of line CD.
(b) Slope of line AB = vo/t
Slope of line CD = vo/0.5t
Slope of line AB/Slope of line CD = (vo /t)/(vo /0.5t)
Slope of line AB:Slope of line CD :: 1:2.
APPEARS IN
संबंधित प्रश्न
A train moving with a velocity of 20 ms−1 is brought to rest by applying brakes in 5 s. Calculate the retardation.
When is the acceleration due to gravity positive?
A body falls towards the earth. Does it have positive or negative acceleration?
What happens to the stepwise increasing speed-time graph when the size of each step is made very small?
Sketch the shape of the velocity-time graph for a body moving with:
Uniform acceleration.
A car accelerates to a velocity of 30 m/s in 10 s and then decelerates for 20 s so that it stops. Draw a velocity-time graph to represent the motion and find:
The Deceleration.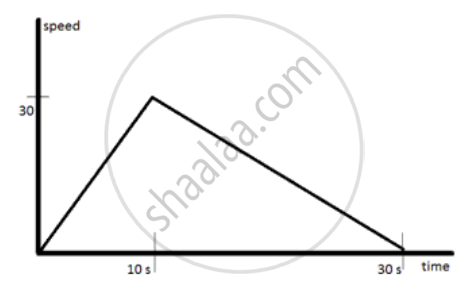
Figure represents graphically the velocity of a car moving along a straight road over a period of 100 hours.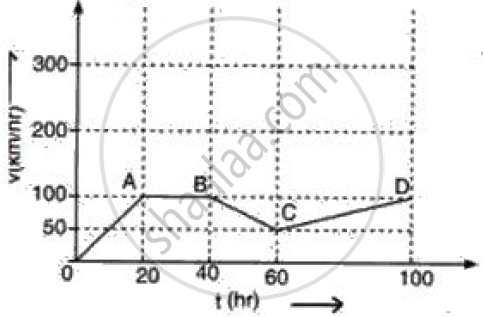
Calculate the acceleration along AB and the retardation along BC.
Negative acceleration is called ______.
An object can be moving with uniform speed but with variable acceleration.
It is possible to have objects moving with uniform speed but variable acceleration.
