Advertisements
Advertisements
प्रश्न
Figure given below shows a velocity-time graph for a car starting from rest. The graph has three parts AB, BC and CD.
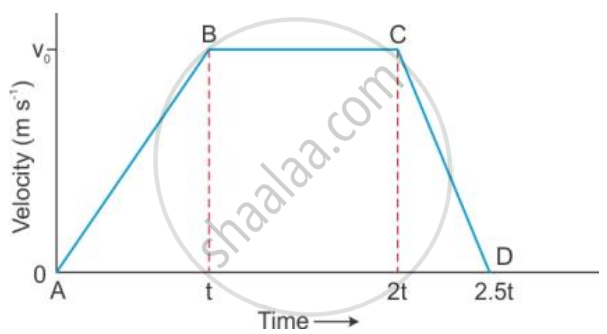
Which part of graph shows motion with uniform
(a) velocity (b) acceleration (c) retardation ?
Advertisements
उत्तर
(a) BC shows motion with uniform velocity.
(b) AB shows motion with uniform acceleration.
(c) CD shows motion with uniform retardation.
APPEARS IN
संबंधित प्रश्न
Give one example of the following motion:
Uniform retardation
Draw a graph for acceleration against time for a uniformly accelerated motion. How can it be used to find the change in speed in a certain interval of time?
A bullet initially moving with a velocity 20 m/s strikes a target and comes to rest after penetrating a distance 10 cm into the target. Calculate the retardation caused by the target.
A ball is rolling from A to D on a flat and smooth surface. Its speed is 2 cm/s. On reaching B, it was pushed continuously up to C. On reaching D from C, its speed had become 4 cm/s. It took 2 seconds for it to go from B to C. What is the acceleration of the ball as it goes from B to C?

Give an example of an accelerated body, moving with a uniform speed.
A motorbike, initially at rest, picks up a velocity of 72 kmh−1 over a distance of 40 m. Calculate
- acceleration
- time in which it picks up above velocity.
The slope of a velocity-time graph gives ______.
When a body starts from rest, the acceleration of the body after 2 seconds in ______ of its displacement.
m/s2 is the unit of ______.
If a body starts from rest, what can be said about the acceleration of the body?
