Advertisements
Advertisements
प्रश्न
Using the following data, draw time - displacement graph for a moving object:
| Time (s) | 0 | 2 | 4 | 6 | 8 | 10 | 12 | 14 | 16 |
| Displacement (m) | 0 | 2 | 4 | 4 | 4 | 6 | 4 | 2 | 0 |
Use this graph to find average velocity for the first 4 s, for the next 4 s and for the last 6 s.
Advertisements
उत्तर
From the given data, the displacement-time graph is shown as

Average velocity = `("Change in displacement")/("time interval")`
∴ For first 4s, v1 = `(4 - 0)/4`
= 1 ms−1
For next 4s v2 = `(4 - 4)/4`
= 0 ms−1
For last 6s v3 = `(0 - 6)/6`
= −1 ms−1
APPEARS IN
संबंधित प्रश्न
A body is moving along a circular path of radius R. What will be the distance travelled and displacement of the body when it completes half a revolution ?
What can you say about the nature of motion of a body if its displacement-time graph is A curve.
Figure given below shows a velocity-time graph for a car starting from rest. The graph has three parts AB, BC and CD.
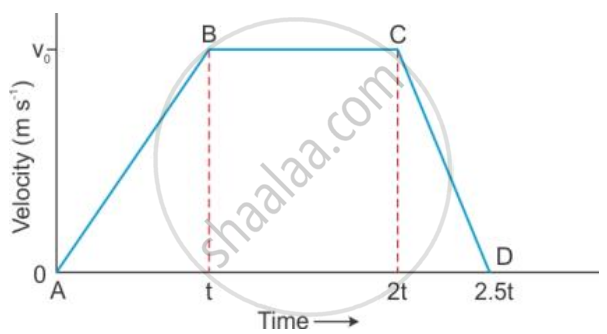
State how is the distance travelled in any part determined from this graph .
A body starts from rest with uniform acceleration 2 m s-2. Find the distance covered by the body in 2 s.
How can you find the following?
Velocity from a displacement – time graph.
Show the difference between distance and displacement with the help of a diagram.
Under what condition is the displacement of a body equal to the distance traveled by it?
An object covers a distance of S meters in t seconds as follows :
| S (meters) | 0 | 8 | 20 | 20 | 16 | 10 | 0 |
| t (Seconds) | 80 | 2 | 5 | 10 | 12 | 15 | 10 |
Plot a graph, taking t on X-axis and S on Y-axis. Determine the velocity of the object at time
(i) 6 s, and
(ii) 14 s.
Which of the following figures represent uniform motion of a moving object correctly?
A scalar quantity has ______.
