Advertisements
Advertisements
प्रश्न
Figure given below shows a velocity-time graph for a car starting from rest. The graph has three parts AB, BC and CD.
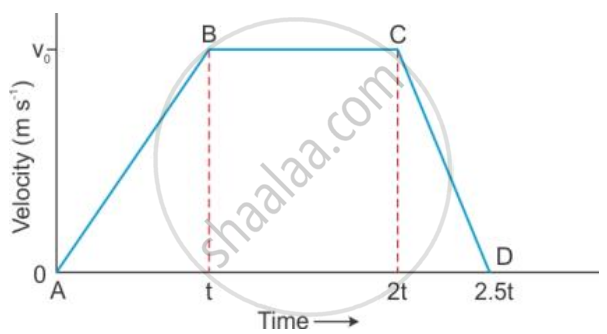
State how is the distance travelled in any part determined from this graph .
Advertisements
उत्तर
Distance travelled in any part of the graph can be determined by finding the area enclosed by the graph in that part with the time axis.
APPEARS IN
संबंधित प्रश्न
What information about the motion of a body are obtained from the displacement-time graph?
Draw a velocity-time graph for a body moving with an initial velocity u and uniform acceleration a. Use this graph to find the distance travelled by the body in time t.
How can you find the following?
Displacement from velocity – time graph.
A satellite makes a complete round along its circular orbit. What is its displacement?
A car travels at a uniform speed of 42 km/h. In 10 minutes, how much distance would it cover?
An object covers a distance of S meters in t seconds as follows :
| S (meters) | 0 | 8 | 20 | 20 | 16 | 10 | 0 |
| t (Seconds) | 80 | 2 | 5 | 10 | 12 | 15 | 10 |
Plot a graph, taking t on X-axis and S on Y-axis. Determine the velocity of the object at time
(i) 6 s, and
(ii) 14 s.
The shortest distance between two places is ______.
Fill in the boxes.
| S.No | First Move | Seconde Move | Distance (m) | Displacement |
| 1. | Move 4 metres east | Move 2 metres west | 6 | 2 m east |
| 2. | Move 4 metres north | Move 2 metres south | ||
| 3. | Move 2 metres east | Move 4 metres west | ||
| 4. | Move 5 metres east | Move 5 metres west | ||
| 5. | Move 5 metres south | Move 2 metres north | ||
| 6. | Move 10 metres west | Move 3 metres east |
An object is dropped from rest at a height of 150 m and simultaneously another object is dropped from rest at a height of 100 m. What is the difference in their heights after 2s if both the objects drop with the same accelerations? How does the difference in heights vary with time?
Displacement is the ______ distance covered by a body.
