Advertisements
Advertisements
Question
Which of the following countries has the highest biodiversity?
Options
South America
South Africa
Russia
India
Advertisements
Solution
South America
APPEARS IN
RELATED QUESTIONS
Explain, giving three reasons, why tropics show greatest levels of species diversity.
Observe the graph and select the correct option:
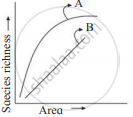
Latitudinal and altitudinal gradient is shown by which of the following habitat(s)?
All are true regarding graph showing species richness - area relationship, EXCEPT ______.
Which of the following is an observation of Alexander von Humboldt's documented pattern in ecology?
The graph of species richness and area for a number of taxa like angiospermic plants, freshwater fishes, and birds is found to be ______.
Which of these is true about tropical environments?
The pattern of biodiversity is affected by ______.
A species-area curve is drawn by plotting the number of species against the area. How is it that when a very large area is considered the slope is steeper than that for smaller areas?
There is greater biodiversity in tropical /subtropical regions than in temperate region. Explain.
Is it true that there is more solar energy available in the tropics? Explain briefly.
Species diversity decreases as we move away from the equator towards the poles. What could be the possible reasons?
Study the graph given below:
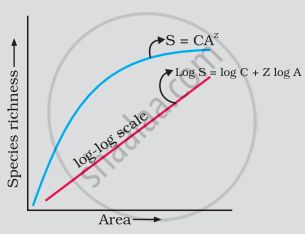
As per Alexander von Humboldt, what do the symbols S, A, Z and C in the graph stand for, in respect of a species and area relationship?
The species-area relationship is represented on a log scale as ______.
For frugivorous (fruit-eating) birds and mammals in the tropical forests of different continents, the slope of the species-area relationship is found to be approximately ______.
Tropical regions show greatest level of species richness because -
- Tropical latitudes have remained relatively undisturbed for millions of years, hence more time was available for species diversification.
- Tropical environments are more seasonal.
- More solar energy is available in tropics.
- Constant environments promote niche specialization.
- Tropical environments are constant and predictable.
Choose the correct answer form the options given below:
The latitudinal gradient describes a pattern where species richness is highest in which geographic region?
The altitudinal gradient describes a pattern where species diversity is greatest at which elevation?
Alexander von Humboldt developed observations leading to the discovery of which relationship in ecology?
