Advertisements
Advertisements
Question
Mr. Mirza’s monthly income is Rs. 7,200. He spends Rs. 1,800 on rent, Rs. 2,700 on food, Rs. 900 on the education of his children; Rs. 1,200 on Other things and saves the rest.
Draw a pie-chart to represent it.
Advertisements
Solution
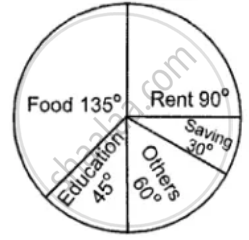
| Name of items | Expenditure/Saving in Rupees | Central angle |
| Rent | 1800 | `1800/7200 xx 360^circ = 90^circ` |
| food | 2700 | `2700/7200 xx 360^circ = 135^circ` |
| Education | 900 | `900/7200 xx 360^circ = 45^circ` |
| Others | 1200 | `1200/7200 xx 360^circ = 60^circ` |
| Saving | 600 | `600/7200 xx 360^circ = 30^circ` |
| Total | 7200 | `360^circ` |
APPEARS IN
RELATED QUESTIONS
Given below are the seats won by different political parties in the polling outcome of a state assembly elections:-
| Political Party | A | B | C | D | E | F |
| Seats Won | 75 | 55 | 37 | 29 | 10 | 37 |
- Draw a bar graph to represent the polling results.
- Which political party won the maximum number of seats?
A random survey of the number of children of various age groups playing in a park was found as follows:
| Age (in years) | Number of children |
| 1 - 2 | 5 |
| 2 - 3 | 3 |
| 3 - 5 | 6 |
| 5 - 7 | 12 |
| 7 - 10 | 9 |
| 10 - 15 | 10 |
| 15 - 17 | 4 |
Draw a histogram to represent the data above.
Read the following bar graph (Fig. 23.12) and answer the following questions:
(i) What is the information given by the bar graph?
(ii) State each of the following whether true or false.
a. The number of government companies in 1957 is that of 1982 is 1 :9.
b. The number of government companies have decreased over the year 1957 to 1983.

The following data gives the amount of loans (in crores of rupees) disbursed by a bank during some years:
| Year | 1992 | 1993 | 1994 | 1995 | 1996 |
| Loan (in crores of rupees) |
28 | 33 | 55 | 55 | 80 |
(i) Represent the above data with the help of a bar graph.
(ii) With the help of the bar graph, indicate the year in which amount of loan is not increased over that of the preceding year.
The time taken, in seconds, to solve a problem by each of 25 pupils is as follows:
16, 20, 26, 27, 28, 30, 33, 37, 38, 40, 42, 43, 46, 46, 46, 48, 49, 50, 53, 58, 59, 60, 64, 52, 20
(a) Construct a frequency distribution for these data, using a class interval of 10 seconds.
(b) Draw a histogram to represent the frequency distribution.
The following is the distribution of total household expenditure (in Rs.) of manual worker in a city:
| Expenditure (in Rs): |
100-150 | 150-200 | 200-250 | 250-300 | 300-350 | 350-400 | 400-450 | 450-500 |
| No. of manual workers: | 25 | 40 | 33 | 28 | 30 | 22 | 16 | 8 |
Draw a histogram and a frequency polygon representing the above data.
In a histogram, each class rectangle is constructed with base as
A hundred students from a certain locality use different modes of travelling to school as given below. Draw a bar graph.
| Bus | Car | Rickshaw | Bicycle | Walk |
| 32 | 16 | 24 | 20 | 8 |
Draw a histogram of the following distribution:
| Heights (in cm) | Number of students |
| 150 – 153 | 7 |
| 153 – 156 | 8 |
| 156 – 159 | 14 |
| 159 – 162 | 10 |
| 162 – 165 | 6 |
| 165 – 168 | 5 |
Following table gives the distribution of students of sections A and B of a class according to the marks obtained by them.
| Section A | Section B | ||
| Marks | Frequency | Marks | Frequency |
| 0 – 15 | 5 | 0 – 15 | 3 |
| 15 – 30 | 12 | 15 – 30 | 16 |
| 30 – 45 | 28 | 30 – 45 | 25 |
| 45 – 60 | 30 | 45 – 60 | 27 |
| 60 –75 | 35 | 60 – 75 | 40 |
| 75 – 90 | 13 | 75 – 90 | 10 |
Represent the marks of the students of both the sections on the same graph by two frequency polygons. What do you observe?
