Advertisements
Advertisements
Question
What coloured flowers did you see?
Advertisements
Solution
I saw different colours of flowers – red, blue, yellow, orange, violet, pink, etc.
APPEARS IN
RELATED QUESTIONS
So in a month you spend about 30 × ______ = ______ hours.
Who likes to get wet in the rain? A child made this Chapati Chart after asking his friends.

See the Chapati Chart and tell -
- How many children like to get wet in the rain?
(a) Half
(b) One-fourth
(c) Three-fourth - How many children do not like to get wet in the rain?
(a) Half
(b) One-fourth
(c) Three-fourth - If the number of children in the class is 28, then tell the number of children
(a) Who like to get wet in the rain?
(b) Who do not like to get wet in the rain?
 |
 |
 |
 |
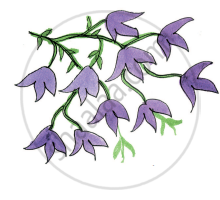
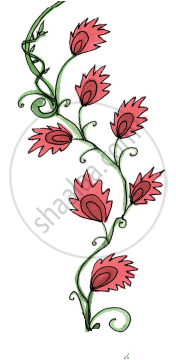
| Colour of flowers | Number of flowers |
| Blue | 9 |
| Red | 7 |
| Orange | 5 |
| Purple | 10 |
Draw the right flower. Write how many there are.
______ are the least in number. How many?
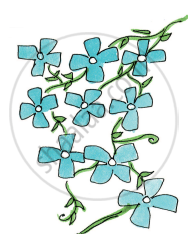
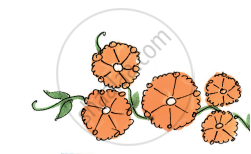
| Colour of flowers | Number of flowers |
| Blue | 9 |
| Red | 7 |
| Orange | 5 |
| Purple | 10 |
Draw the right flower. Write how many there are.
 |
 |
 |
 |
______ are more than ______
Answer the following question.
The number of people walking is more than the number of ______.
| Favourite sweet | Number of people |
| Jalebi | 20 |
| Rasgulla | 18 |
| Jamun | 25 |
| Laddoo | 22 |
| Burfi | 17 |
| Kalakand | 15 |
| Absent Students' Chart | |
| Class | Absent student |
| Class I |   |
| Class II |  |
| Class III |    |
| Class IV |     |
| Class V |   |
Now look at the chart and fill in the blanks:
The class with the highest number of absent students is ______.
Fill in the blanks:
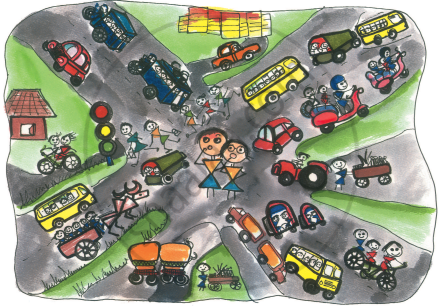
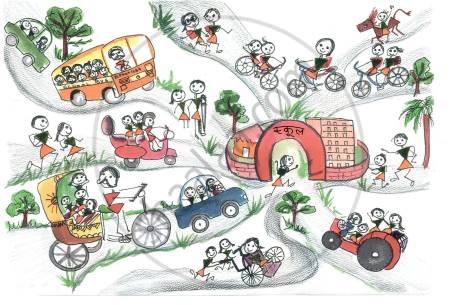
The most number of students come to school by ______.
Make your own smart charts about things around you.
Which vegetable is most disliked? Ask your friends and complete the table.
| Vegetable disliked | Number of students |
