Advertisements
Advertisements
Question
| Colour of flowers | Number of flowers |
| Blue | 9 |
| Red | 7 |
| Orange | 5 |
| Purple | 10 |
Draw the right flower. Write how many there are.
 |
 |
 |
 |
______ are more than ______
Options
- और
- और
- और
- और
Advertisements
Solution
are more than
APPEARS IN
RELATED QUESTIONS
Find out from your friends the time they spend in a week.
|
How many hours they watch TV or listen to the radio (in a week) |
Number of children |
| More than 6 hours | |
| Six hours | |
| Five hours | |
| Four hours | |
| Three hours | |
| Two hours | |
| One hour | |
| Zero hour (do not watch) |

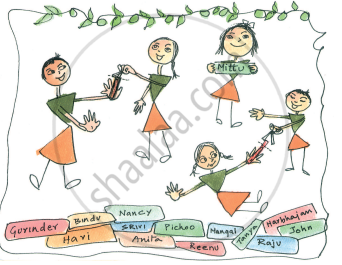
- How many children are acting in the drama?
- Which are more-children making the sets or those acting?
- What is being done by most of the children?
- How many children are collecting dresses?
Answer the following question.
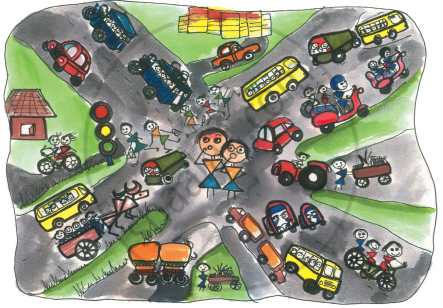
The number of buses is less than the number of ______.
| Favourite sweet | Number of people |
| Jalebi | 20 |
| Rasgulla | 18 |
| Jamun | 25 |
| Laddoo | 22 |
| Burfi | 17 |
| Kalakand | 15 |
| Number of people living together | How many families |
| 1 alone | 2 |
| 2 people | 5 |
| 3 people | 8 |
| 4 people | 6 |
| 5 people | 4 |
| 6 people | 2 |
| 7 people | 2 |
| 8 people | 1 |
The least number of people living in a home is ______
|
Attendance Board Date 8/2/2007 |
|||
| Class | Number of Students | Students Present | Students absent |
| Class I | 27 | 25 | 2 |
| Class II | 23 | 22 | 1 |
| Class III | 24 | 21 | 3 |
| Class IV | 22 | 18 | 4 |
| Class V | 25 | 23 | 2 |
| Total | |||
This board shows the number of students in each class. It also shows the number of students present and absent.
How many children in all are there in the school?
| Absent Students' Chart | |
| Class | Absent student |
| Class I |   |
| Class II |  |
| Class III |    |
| Class IV |     |
| Class V |   |
Now look at the chart and fill in the blanks:
The class with the highest number of absent students is ______.
- Make a group of 4 friends.
- Cut strips from waste paper. The strips should be of the same width.
- Measure the length of each student's hand with the paper strip. Cut the strip and write the name of the student.
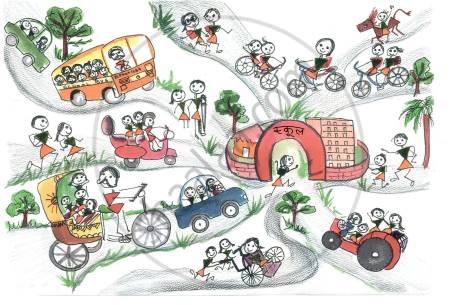
Fill in the blanks:
The most number of students come to school by ______.
Which vegetable is most disliked? Ask your friends and complete the table.
| Vegetable disliked | Number of students |
