Advertisements
Advertisements
प्रश्न
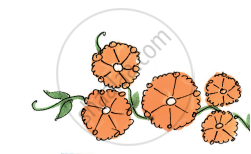
| Colour of flowers | Number of flowers |
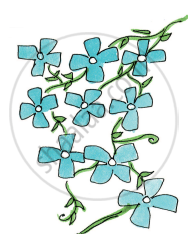
| Blue | 9 |
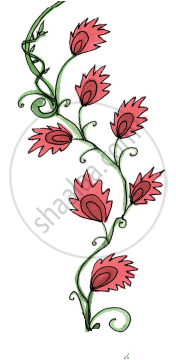
| Red | 7 |
| Orange | 5 |
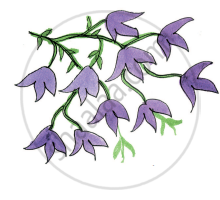
| Purple | 10 |
Draw the right flower. Write how many there are.
 |
 |
 |
 |
______ are more than ______
पर्याय
- और
- और
- और
- और
Advertisements
उत्तर
are more than
APPEARS IN
संबंधित प्रश्न
Find out from your classmates and fill the table.
| Main food | Number of persons |
| Rice | |
| Wheat | |
Look at the table and tell :
- Most children eat food made from ______
- Compared to children who eat rice, those who eat wheat are more/less/equal.
- Compare to those who eat wheat, children eating ragi are more/less.

- How many children are acting in the drama?
- Which are more-children making the sets or those acting?
- What is being done by most of the children?
- How many children are collecting dresses?
Some children were asked which of these they liked most-Tea, Coffee or Milk.
| The Drink they like | Number of children |
| Milk | 20 |
| Coffee | 10 |
| Tea | 10 |
- Total number of children ______
- Children who like milk are `1/2`/ `1/4` of the total children.
- Children who like coffee are `1/2`/`1/4` of the total children.
- Show the liking for Tea, Coffee or Milk in a Chapati Chart.
Were most of the flowers yellow in colour?
 |
 |
 |
 |
| Colour of flowers | Number of flowers |
| Blue | 9 |
| Red | 7 |
| Orange | 5 |
| Purple | 10 |
Draw the right flower. Write how many there are.
______ are the least in number. How many?
Answer the following question.
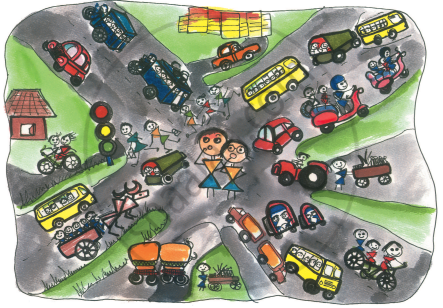
In the picture which way of travel do you see the most?
| Favourite sweet | Number of people |
| Jalebi | 20 |
| Rasgulla | 18 |
| Jamun | 25 |
| Laddoo | 22 |
| Burfi | 17 |
| Kalakand | 15 |
| Absent Students' Chart | |
| Class | Absent student |
| Class I |   |
| Class II |  |
| Class III |    |
| Class IV |     |
| Class V |   |
Now look at the chart and fill in the blanks:
The class with the highest number of absent students is ______.
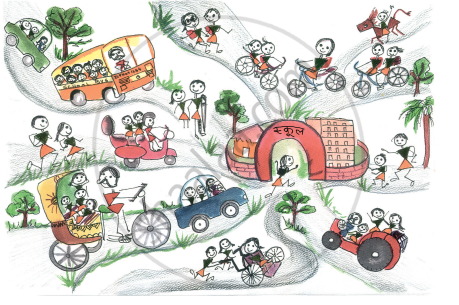
Fill in the blanks:
The least number of students come to school by ______.
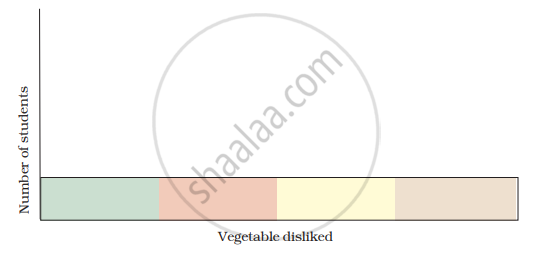
| Vegetable disliked | Number of students |
| Onion | 2 |
| Tomato | 3 |
| Brinjal | 4 |
| Ladyfinger | 2 |
| Potato | 1 |
Use this table to draw faces in the chart below. Draw  for each child on top of the vegetable disliked.