Advertisements
Advertisements
प्रश्न
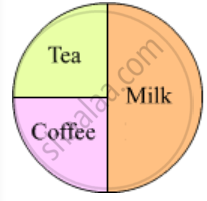
Some children were asked which of these they liked most-Tea, Coffee or Milk.
| The Drink they like | Number of children |
| Milk | 20 |
| Coffee | 10 |
| Tea | 10 |
- Total number of children ______
- Children who like milk are `1/2`/ `1/4` of the total children.
- Children who like coffee are `1/2`/`1/4` of the total children.
- Show the liking for Tea, Coffee or Milk in a Chapati Chart.
Advertisements
उत्तर
- The total number of children = 40
- Children who like milk are `1/2` of the total children.
- Children who like coffee are `1/4` of the total children.
- The Chapati Charts about the liking of children is shown here.
APPEARS IN
संबंधित प्रश्न
Read the poem carefully and answer these questions.
- Which word comes most often in the poem?
- Which letter has been used most?
- Which letter comes the least?
Use a scale and find out from your chart:
- The length of the longest strip is ______ cm.
- So, ______ has the biggest head.
- The smallest strip is ______ cm long. It belongs to ______
Who likes to get wet in the rain? A child made this Chapati Chart after asking his friends.

See the Chapati Chart and tell -
- How many children like to get wet in the rain?
(a) Half
(b) One-fourth
(c) Three-fourth - How many children do not like to get wet in the rain?
(a) Half
(b) One-fourth
(c) Three-fourth - If the number of children in the class is 28, then tell the number of children
(a) Who like to get wet in the rain?
(b) Who do not like to get wet in the rain?
Were most of the flowers yellow in colour?
 |
 |
 |
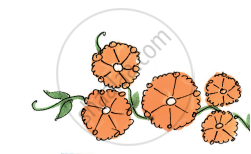 |
| Colour of flowers | Number of flowers |
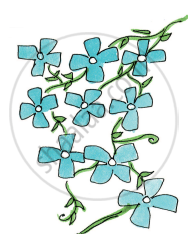
| Blue | 9 |
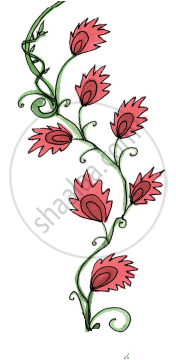
| Red | 7 |
| Orange | 5 |
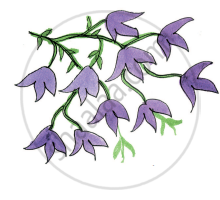
| Purple | 10 |
Draw the right flower. Write how many there are.
______ are the most in number. How many?
|
|
|
|
| Colour of flowers | Number of flowers |
| Blue | 9 |
| Red | 7 |
| Orange | 5 |
| Purple | 10 |
Draw the right flower. Write how many there are.
______ are the least in number. How many?
Answer the following question.
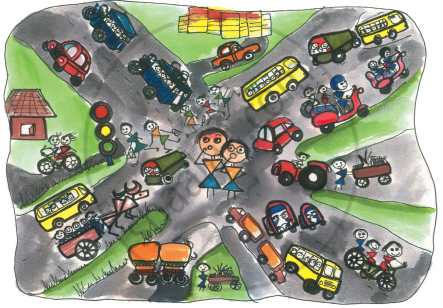
The number of buses is less than the number of ______.
| Favourite sweet | Number of people |
| Jalebi | 20 |
| Rasgulla | 18 |
| Jamun | 25 |
| Laddoo | 22 |
| Burfi | 17 |
| Kalakand | 15 |
| Absent Students' Chart | |
| Class | Absent student |
| Class I |   |
| Class II |  |
| Class III |    |
| Class IV |     |
| Class V |   |
Now look at the chart and fill in the blanks:
The number of students absent in Class IV and Class V are ______ and ______.
Rohan, Jacob and Geeta also measured their hands. They stuck their strips as shown.
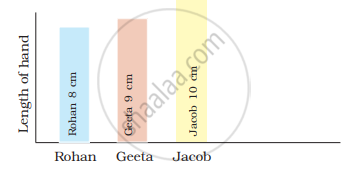
The length of Geeta's hand is ______ than Rohan's hand.
