Advertisements
Advertisements
प्रश्न
| Favourite sweet | Number of people |
| Jalebi | 20 |
| Rasgulla | 18 |
| Jamun | 25 |
| Laddoo | 22 |
| Burfi | 17 |
| Kalakand | 15 |
पर्याय
Burfi and Laddoo
Laddoo and Jamun
Rasgulla and Jamun
Burfi and Kalakand
Advertisements
उत्तर
Burfi is liked more than Kalakand.
APPEARS IN
संबंधित प्रश्न
Take a paragraph you like from your language textbook. Read carefully and find out.
- Which word comes most often? How many times?
- Which word comes least often?
- The letter used most often is ______
- The letter used least often is ______
Use a scale and find out from your chart:
- The length of the longest strip is ______ cm.
- So, ______ has the biggest head.
- The smallest strip is ______ cm long. It belongs to ______
All children of a school take part in different clubs:
The Chapati Chart shows the number of children in different clubs.

From the picture we can see that:
- Half the children in the class take part in the Games Club.
- One fourth of the children are members of the Garden Club.
- The Drawing Club has one fourth of the children of the class.
If there are 200 students in the school, look at the above Chapati Chart and tell the number of members in each club :
- The Games Club has ______ members.
- The Garden Club has ______ members.
- There are ______ members in the Drawing Club.
 |
 |
 |
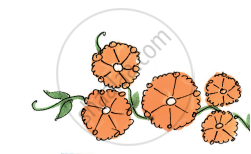 |
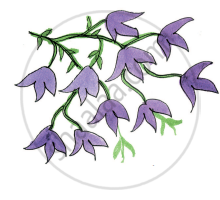
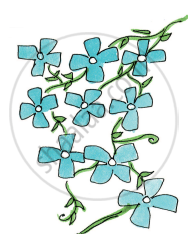
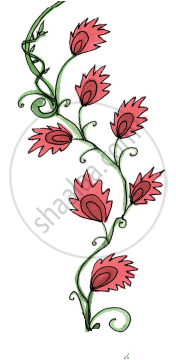
| Colour of flowers | Number of flowers |
| Blue | 9 |
| Red | 7 |
| Orange | 5 |
| Purple | 10 |
Draw the right flower. Write how many there are.
______ are the most in number. How many?
| Face of the die | Number of times ( / for each throw) |
 |
| | | | | |
 |
| | | |
 |
| | | | | |
 |
| | | | |
 |
| | | | | | | |
 |
| | | | | | |
Which face of the die did you get the most number of times?
| Face of the die | Number of times ( / for each throw) |
|
| | | | | |
|
| | | |
|
| | | | | |
|
| | | | |
|
| | | | | | | |
|
| | | | | | |
Compare your table with that of the student sitting next to you. Do you find any difference in the two tables?
| Favourite sweet | Number of people |
| Jalebi | 20 |
| Rasgulla | 18 |
| Jamun | 25 |
| Laddoo | 22 |
| Burfi | 17 |
| Kalakand | 15 |
| Food item | Number of students |
| Lemon rice | 7 |
| Meals | 12 |
| Curd rice | 5 |
| Fried rice | 3 |
| Tomato rice | 2 |
Food item brought for lunch by the biggest number of students ______.
Make your own smart charts about things around you.
| Bird | Sparrow | Crow | Parrot | Peacock | Hen |
| Colours | 2 | 1 | 2 | 10 | 4 |
Which bird has the most colours?
