Advertisements
Advertisements
प्रश्न
Take a paragraph you like from your language textbook. Read carefully and find out.
- Which word comes most often? How many times?
- Which word comes least often?
- The letter used most often is ______
- The letter used least often is ______
एका वाक्यात उत्तर
Advertisements
उत्तर
Do it yourself.
shaalaa.com
Smart Charts
या प्रश्नात किंवा उत्तरात काही त्रुटी आहे का?
APPEARS IN
संबंधित प्रश्न
Read the poem carefully and answer these questions.
- Which word comes most often in the poem?
- Which letter has been used most?
- Which letter comes the least?
Were most of the flowers yellow in colour?
| Favourite sweet | Number of people |
| Jalebi | 20 |
| Rasgulla | 18 |
| Jamun | 25 |
| Laddoo | 22 |
| Burfi | 17 |
| Kalakand | 15 |
From the above table answer the following:
______ is liked more than ______
| Favourite sweet | Number of people |
| Jalebi | 20 |
| Rasgulla | 18 |
| Jamun | 25 |
| Laddoo | 22 |
| Burfi | 17 |
| Kalakand | 15 |
From the above table answer the following:
______ is liked more than ______
| Absent Students' Chart | |
| Class | Absent student |
| Class I |   |
| Class II |  |
| Class III |    |
| Class IV |     |
| Class V |   |
Now look at the chart and fill in the blanks:
The class with the highest number of absent students is ______.
| Absent Students' Chart | |
| Class | Absent student |
| Class I | |
| Class II | |
| Class III | |
| Class IV | |
| Class V | |
Now look at the chart and fill in the blanks:
The class with the least number of absent students is ______.
| Absent Students' Chart | |
| Class | Absent student |
| Class I | |
| Class II | |
| Class III | |
| Class IV | |
| Class V | |
Now look at the chart and fill in the blanks:
The class with 3 students absent is ______.
| Absent Students' Chart | |
| Class | Absent student |
| Class I | |
| Class II | |
| Class III | |
| Class IV | |
| Class V | |
Now look at the chart and fill in the blanks:
The number of students absent in Class IV and Class V are ______ and ______.
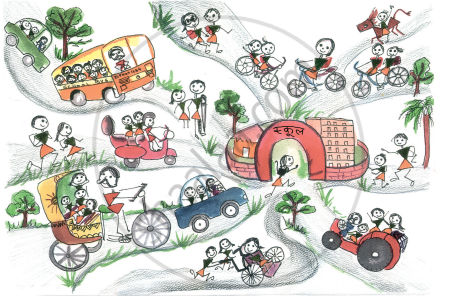
Look at the picture and fill in the table.
| Way of coming | Tractor | ______ | ______ | ______ |
| Number of students | 3 | ______ | ______ | ______ |
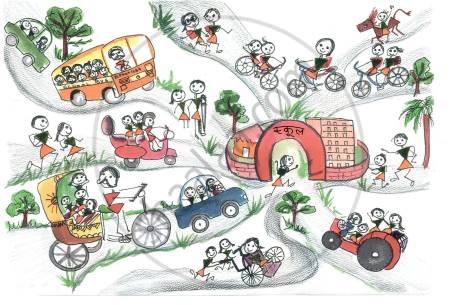
Fill in the blanks:
The most number of students come to school by ______.
