Advertisements
Advertisements
प्रश्न
All children of a school take part in different clubs:
The Chapati Chart shows the number of children in different clubs.

From the picture we can see that:
- Half the children in the class take part in the Games Club.
- One fourth of the children are members of the Garden Club.
- The Drawing Club has one fourth of the children of the class.
If there are 200 students in the school, look at the above Chapati Chart and tell the number of members in each club :
- The Games Club has ______ members.
- The Garden Club has ______ members.
- There are ______ members in the Drawing Club.
Advertisements
उत्तर
- The Games Club has 100 members.
- The Garden Club has 50 members.
- There are 50 members in the Drawing Club.
APPEARS IN
संबंधित प्रश्न
So in a month you spend about 30 × ______ = ______ hours.
Have you been to a park?
| Colour of flowers | Number of flowers |
| Blue | 9 |
| Red | 7 |
| Orange | 5 |
| Purple | 10 |
Draw the right flower. Write how many there are.
 |
 |
 |
 |
______ are more than ______
Rabia threw her die 30 times. She got  five times. In her table she marked:
Now fill in the table:
| Face of the die | Number of times ( / for each throw) |
 |
|
 |
|
 |
|
 |
|
 |
|
 |
| Face of the die | Number of times ( / for each throw) |
|
| | | | | |
|
| | | |
|
| | | | | |
|
| | | | |
|
| | | | | | | |
|
| | | | | | |
came up more number of times than ______.
| Number of people living together | How many families |
| 1 alone | 2 |
| 2 people | 5 |
| 3 people | 8 |
| 4 people | 6 |
| 5 people | 4 |
| 6 people | 2 |
| 7 people | 2 |
| 8 people | 1 |
The least number of people living in a home is ______
| Food item | Number of students |
| Lemon rice | 7 |
| Meals | 12 |
| Curd rice | 5 |
| Fried rice | 3 |
| Tomato rice | 2 |
Food item brought by the smallest number of students ______
Rohan, Jacob and Geeta also measured their hands. They stuck their strips as shown.
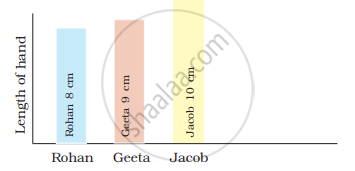
Look at the picture and fill in the blanks:
______ has the shortest hand.
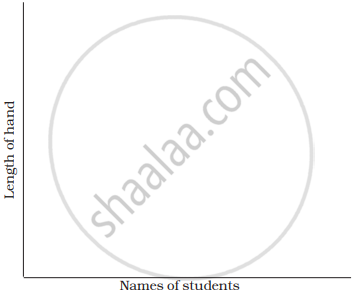
In the chart below stick the strips of all the friends in your group. Keep some space between the strips.
Fill in the blanks:
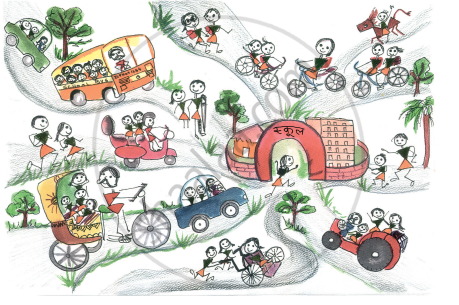
The least number of students come to school by ______.
