Advertisements
Advertisements
Question
All children of a school take part in different clubs:
The Chapati Chart shows the number of children in different clubs.

From the picture we can see that:
- Half the children in the class take part in the Games Club.
- One fourth of the children are members of the Garden Club.
- The Drawing Club has one fourth of the children of the class.
If there are 200 students in the school, look at the above Chapati Chart and tell the number of members in each club :
- The Games Club has ______ members.
- The Garden Club has ______ members.
- There are ______ members in the Drawing Club.
Advertisements
Solution
- The Games Club has 100 members.
- The Garden Club has 50 members.
- There are 50 members in the Drawing Club.
APPEARS IN
RELATED QUESTIONS

- How many children are acting in the drama?
- Which are more-children making the sets or those acting?
- What is being done by most of the children?
- How many children are collecting dresses?
Use a scale and find out from your chart:
- The length of the longest strip is ______ cm.
- So, ______ has the biggest head.
- The smallest strip is ______ cm long. It belongs to ______
Some children were asked which of these they liked most-Tea, Coffee or Milk.
| The Drink they like | Number of children |
| Milk | 20 |
| Coffee | 10 |
| Tea | 10 |
- Total number of children ______
- Children who like milk are `1/2`/ `1/4` of the total children.
- Children who like coffee are `1/2`/`1/4` of the total children.
- Show the liking for Tea, Coffee or Milk in a Chapati Chart.
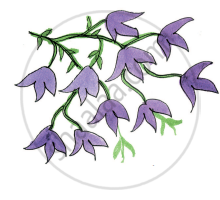
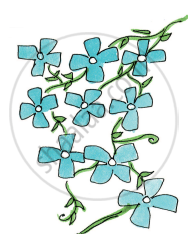
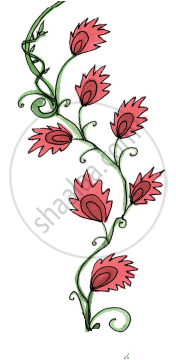
Were most of the flowers yellow in colour?
 |
 |
 |
 |
| Colour of flowers | Number of flowers |
| Blue | 9 |
| Red | 7 |
| Orange | 5 |
| Purple | 10 |
Draw the right flower. Write how many there are.
______ are the least in number. How many?
Answer the following question.
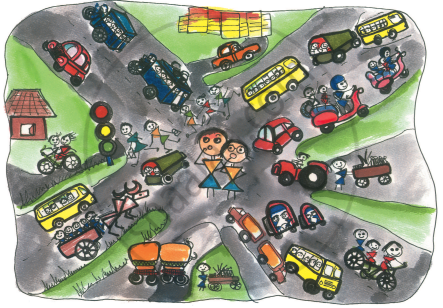
In the picture which way of travel do you see the most?
Answer the following question.

The number of buses is less than the number of ______.
Have you played any games with dice?
| Face of the die | Number of times ( / for each throw) |
 |
| | | | | |
 |
| | | |
 |
| | | | | |
 |
| | | | |
 |
| | | | | | | |
 |
| | | | | | |
How many times did come up? ______ times
Rohan, Jacob and Geeta also measured their hands. They stuck their strips as shown.

Look at the picture and fill in the blanks:
______ has the longest hand.
