Advertisements
Advertisements
Question
| Face of the die | Number of times ( / for each throw) |
 |
| | | | | |
 |
| | | |
 |
| | | | | |
 |
| | | | |
 |
| | | | | | | |
 |
| | | | | | |
How many times did come up? ______ times
Options
3 times
4 times
5 times
6 times
MCQ
Advertisements
Solution
6 times
Explanation -
“6” came up 6 times.
shaalaa.com
Smart Charts
Is there an error in this question or solution?
APPEARS IN
RELATED QUESTIONS
- Ask people in your family to name one programme they like and one programme they dislike. Make a table.
Family member Programme they like Programme they dislike Mother Father - The kind of programme most family members like ______
- The kind of programme most family members dislike ______
 |
 |
 |
 |
| Colour of flowers | Number of flowers |
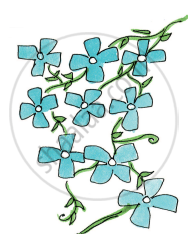
| Blue | 9 |
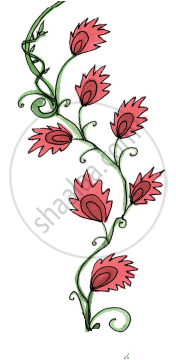
| Red | 7 |
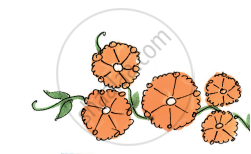
| Orange | 5 |
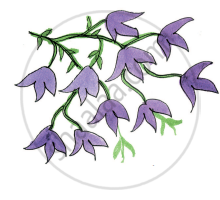
| Purple | 10 |
Draw the right flower. Write how many there are.
______ are the least in number. How many?
How many dots are there on the different faces of a die?
| Face of the die | Number of times ( / for each throw) |
|
| | | | | |
|
| | | |
|
| | | | | |
|
| | | | |
|
| | | | | | | |
|
| | | | | | |
came up more number of times than ______.
| Favourite sweet | Number of people |
| Jalebi | 20 |
| Rasgulla | 18 |
| Jamun | 25 |
| Laddoo | 22 |
| Burfi | 17 |
| Kalakand | 15 |
From the above table answer the following:
Most favourite sweet ______
| Favourite sweet | Number of people |
| Jalebi | 20 |
| Rasgulla | 18 |
| Jamun | 25 |
| Laddoo | 22 |
| Burfi | 17 |
| Kalakand | 15 |
From the above table answer the following:
______ is liked more than ______
Ask your friends about the number of people living in their homes. Fill in the table.
| Number of people living together | How many families |
| 1 alone | |
| 2 people | |
| 3 people | |
| 4 people | |
| 5 people | |
| 6 people | |
| 7 people | |
| 8 people | |
| ................. |
| Food item | Number of students |
| Lemon rice | 7 |
| Meals | 12 |
| Curd rice | 5 |
| Fried rice | 3 |
| Tomato rice | 2 |
Food item brought for lunch by the biggest number of students ______.
Make your own smart charts about things around you.
| Vegetable disliked | Number of students |
| Onion | 2 |
| Tomato | 3 |
| Brinjal | 4 |
| Ladyfinger | 2 |
| Potato | 1 |
The most disliked vegetable is ______
