Advertisements
Advertisements
Question
| Face of the die | Number of times ( / for each throw) |
 |
| | | | | |
 |
| | | |
 |
| | | | | |
 |
| | | | |
 |
| | | | | | | |
 |
| | | | | | |
Which face of the die did you get the most number of times?
Options
4
5
3
2
Advertisements
Solution
5
Explanation -
I got “5” most number of times i.e. seven times.
APPEARS IN
RELATED QUESTIONS
Watching TV/listening to the radio…
- ______ children spend more than 6 hours in a week.
- ______ children spend no time at all.
- Most children spend ______ hours in a week.
- ______ children spend more than 3 hours.
 |
 |
 |
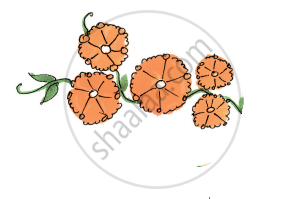 |
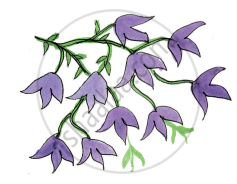
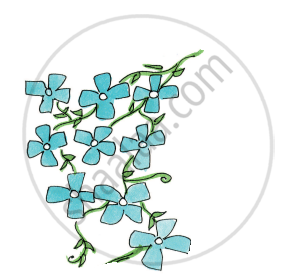
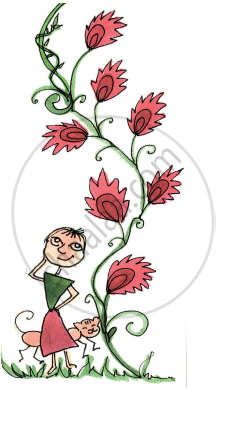
Look at the different flowers in the picture. Complete the table:
| Colour of flowers | Number of flowers |
| Blue | |
| Red | |
| Orange | |
| Purple |
| Face of the die | Number of times ( / for each throw) |
|
| | | | | |
|
| | | |
|
| | | | | |
|
| | | | |
|
| | | | | | | |
|
| | | | | | |
came up more number of times than ______.
| Face of the die | Number of times ( / for each throw) |
|
| | | | | |
|
| | | |
|
| | | | | |
|
| | | | |
|
| | | | | | | |
|
| | | | | | |
Compare your table with that of the student sitting next to you. Do you find any difference in the two tables?
| Favourite sweet | Number of people |
| Jalebi | 20 |
| Rasgulla | 18 |
| Jamun | 25 |
| Laddoo | 22 |
| Burfi | 17 |
| Kalakand | 15 |
From the above table answer the following:
Most favourite sweet ______
| Favourite sweet | Number of people |
| Jalebi | 20 |
| Rasgulla | 18 |
| Jamun | 25 |
| Laddoo | 22 |
| Burfi | 17 |
| Kalakand | 15 |
| Absent Students' Chart | |
| Class | Absent student |
| Class I |   |
| Class II |  |
| Class III |    |
| Class IV |     |
| Class V |   |
Now look at the chart and fill in the blanks:
The class with the highest number of absent students is ______.
Rohan, Jacob and Geeta also measured their hands. They stuck their strips as shown.
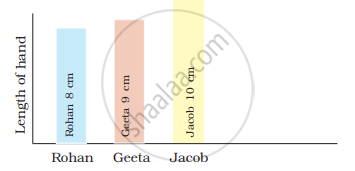
Look at the picture and fill in the blanks:
______ has the shortest hand.
In the chart below stick the strips of all the friends in your group. Keep some space between the strips.
Which vegetable is most disliked? Ask your friends and complete the table.
| Vegetable disliked | Number of students |
