Advertisements
Advertisements
Question
| Face of the die | Number of times ( / for each throw) |
 |
| | | | | |
 |
| | | |
 |
| | | | | |
 |
| | | | |
 |
| | | | | | | |
 |
| | | | | | |
Compare your table with that of the student sitting next to you. Do you find any difference in the two tables?
Options
No, there is no difference in my table and my friend’s table.
Yes, there is difference in my table and my friend’s table.
Advertisements
Solution
Yes, there is difference in my table and my friend’s table.
APPEARS IN
RELATED QUESTIONS
Find out from your friends the time they spend in a week.
|
How many hours they watch TV or listen to the radio (in a week) |
Number of children |
| More than 6 hours | |
| Six hours | |
| Five hours | |
| Four hours | |
| Three hours | |
| Two hours | |
| One hour | |
| Zero hour (do not watch) |
Some children were asked which of these they liked most-Tea, Coffee or Milk.
| The Drink they like | Number of children |
| Milk | 20 |
| Coffee | 10 |
| Tea | 10 |
- Total number of children ______
- Children who like milk are `1/2`/ `1/4` of the total children.
- Children who like coffee are `1/2`/`1/4` of the total children.
- Show the liking for Tea, Coffee or Milk in a Chapati Chart.
 |
 |
 |
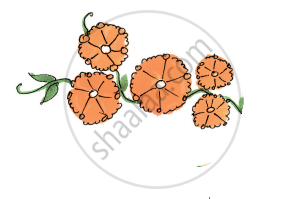 |
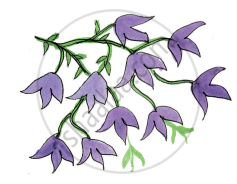
Look at the different flowers in the picture. Complete the table:
| Colour of flowers | Number of flowers |
| Blue | |
| Red | |
| Orange | |
| Purple |
| Favourite sweet | Number of people |
| Jalebi | 20 |
| Rasgulla | 18 |
| Jamun | 25 |
| Laddoo | 22 |
| Burfi | 17 |
| Kalakand | 15 |
Ask your friends about the number of people living in their homes. Fill in the table.
| Number of people living together | How many families |
| 1 alone | |
| 2 people | |
| 3 people | |
| 4 people | |
| 5 people | |
| 6 people | |
| 7 people | |
| 8 people | |
| ................. |
| Number of people living together | How many families |
| 1 alone | 2 |
| 2 people | 5 |
| 3 people | 8 |
| 4 people | 6 |
| 5 people | 4 |
| 6 people | 2 |
| 7 people | 2 |
| 8 people | 1 |
The least number of people living in a home is ______
| Number of people living together | How many families |
| 1 alone | 2 |
| 2 people | 5 |
| 3 people | 8 |
| 4 people | 6 |
| 5 people | 4 |
| 6 people | 2 |
| 7 people | 2 |
| 8 people | 1 |
Most families have ______ people living in their homes.
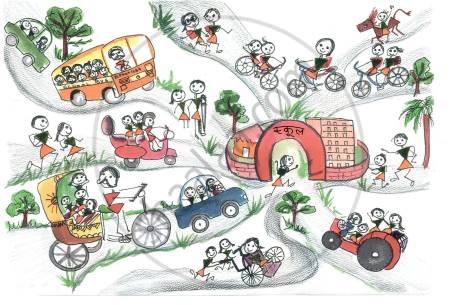
Fill in the blanks:
The most number of students come to school by ______.
| Vegetable disliked | Number of students |
| Onion | 2 |
| Tomato | 3 |
| Brinjal | 4 |
| Ladyfinger | 2 |
| Potato | 1 |
Use this table to draw faces in the chart below. Draw  for each child on top of the vegetable disliked.
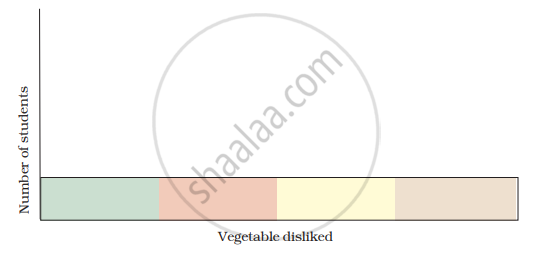
| Vegetable disliked | Number of students |
| Onion | 2 |
| Tomato | 3 |
| Brinjal | 4 |
| Ladyfinger | 2 |
| Potato | 1 |
The vegetable disliked by very few children is ______.
