Advertisements
Advertisements
Question
Find out from your friends the time they spend in a week.
|
How many hours they watch TV or listen to the radio (in a week) |
Number of children |
| More than 6 hours | |
| Six hours | |
| Five hours | |
| Four hours | |
| Three hours | |
| Two hours | |
| One hour | |
| Zero hour (do not watch) |
Advertisements
Solution
I talked to my friends about their hours spent on TV which are as follows:
|
How many hours they watch TV |
Number of children |
| More than 6 hours | 20 |
| Six hours | 15 |
| Five hours | 15 |
| Four hours | 15 |
| Three hours | 10 |
| Two hours | 12 |
| One hour | 14 |
| Zero hour (do not watch) | 10 |
APPEARS IN
RELATED QUESTIONS
So in a month you spend about 30 × ______ = ______ hours.
Who likes to get wet in the rain? A child made this Chapati Chart after asking his friends.

See the Chapati Chart and tell -
- How many children like to get wet in the rain?
(a) Half
(b) One-fourth
(c) Three-fourth - How many children do not like to get wet in the rain?
(a) Half
(b) One-fourth
(c) Three-fourth - If the number of children in the class is 28, then tell the number of children
(a) Who like to get wet in the rain?
(b) Who do not like to get wet in the rain?
Look at the traffic scene in the picture and fill in the table.
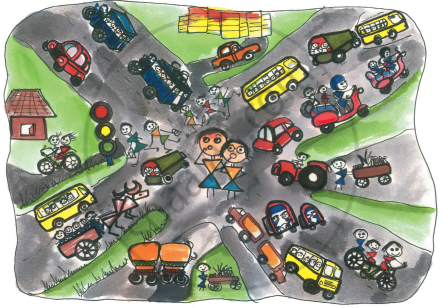
| Way of Travel | How many |
| Walking (people) | |
| Bicycles | |
| Scooters | |
| Favourite sweet | Number of people |
| Jalebi | 20 |
| Rasgulla | 18 |
| Jamun | 25 |
| Laddoo | 22 |
| Burfi | 17 |
| Kalakand | 15 |
| Number of people living together | How many families |
| 1 alone | 2 |
| 2 people | 5 |
| 3 people | 8 |
| 4 people | 6 |
| 5 people | 4 |
| 6 people | 2 |
| 7 people | 2 |
| 8 people | 1 |
The least number of people living in a home is ______
| Absent Students' Chart | |
| Class | Absent student |
| Class I |   |
| Class II |  |
| Class III |    |
| Class IV |     |
| Class V | |
This is a chart to show the number of absent students. Each absent student is shown by  .
.
In the chart show the absent students of Class V.
| Absent Students' Chart | |
| Class | Absent student |
| Class I | |
| Class II | |
| Class III | |
| Class IV | |
| Class V |   |
Now look at the chart and fill in the blanks:
The class with 3 students absent is ______.
Rohan, Jacob and Geeta also measured their hands. They stuck their strips as shown.
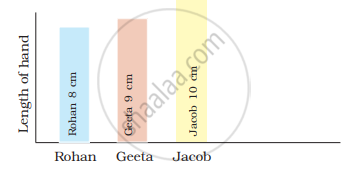
The length of Geeta's hand is ______ than Rohan's hand.
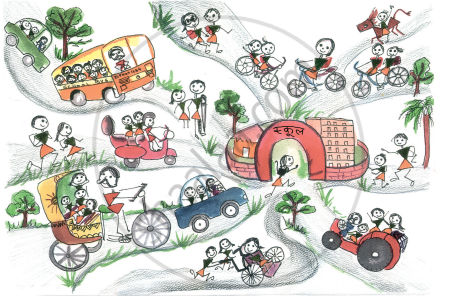
Look at the picture and fill in the table.
| Way of coming | Tractor | ______ | ______ | ______ |
| Number of students | 3 | ______ | ______ | ______ |
Which vegetable is most disliked? Ask your friends and complete the table.
| Vegetable disliked | Number of students |
