Advertisements
Advertisements
Question
So in a month you spend about 30 × ______ = ______ hours.
Advertisements
Solution
In a month I spend about 30 × 1 = 30 hours
APPEARS IN
RELATED QUESTIONS
- Ask people in your family to name one programme they like and one programme they dislike. Make a table.
Family member Programme they like Programme they dislike Mother Father - The kind of programme most family members like ______
- The kind of programme most family members dislike ______
Take a paragraph you like from your language textbook. Read carefully and find out.
- Which word comes most often? How many times?
- Which word comes least often?
- The letter used most often is ______
- The letter used least often is ______
Were most of the flowers yellow in colour?
| Face of the die | Number of times ( / for each throw) |
 |
| | | | | |
 |
| | | |
 |
| | | | | |
 |
| | | | |
 |
| | | | | | | |
 |
| | | | | | |
Compare your table with that of the student sitting next to you. Do you find any difference in the two tables?
| Favourite sweet | Number of people |
| Jalebi | 20 |
| Rasgulla | 18 |
| Jamun | 25 |
| Laddoo | 22 |
| Burfi | 17 |
| Kalakand | 15 |
| Absent Students' Chart | |
| Class | Absent student |
| Class I |   |
| Class II |  |
| Class III |    |
| Class IV |     |
| Class V |   |
Now look at the chart and fill in the blanks:
The class with 3 students absent is ______.
| Absent Students' Chart | |
| Class | Absent student |
| Class I | |
| Class II | |
| Class III | |
| Class IV | |
| Class V | |
Now look at the chart and fill in the blanks:
The number of students absent in Class IV and Class V are ______ and ______.
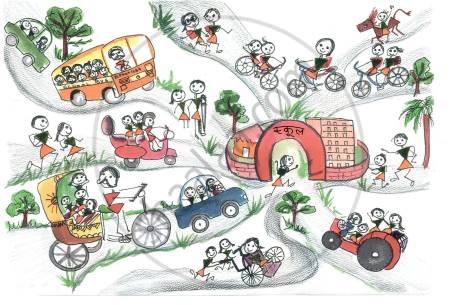
Fill in the blanks:
The most number of students come to school by ______.
 Fill in the blanks:
The number of students walking to school is ______ than the students coming on bicycle.
| Vegetable disliked | Number of students |
| Onion | 2 |
| Tomato | 3 |
| Brinjal | 4 |
| Ladyfinger | 2 |
| Potato | 1 |
The vegetable disliked by very few children is ______.
