Advertisements
Advertisements
प्रश्न
| Face of the die | Number of times ( / for each throw) |
 |
| | | | | |
 |
| | | |
 |
| | | | | |
 |
| | | | |
 |
| | | | | | | |
 |
| | | | | | |
How many times did come up? ______ times
विकल्प
3 times
4 times
5 times
6 times
Advertisements
उत्तर
6 times
Explanation -
“6” came up 6 times.
APPEARS IN
संबंधित प्रश्न
How much time do we spend in this?
Read the poem carefully and answer these questions.
- Which word comes most often in the poem?
- Which letter has been used most?
- Which letter comes the least?
Who likes to get wet in the rain? A child made this Chapati Chart after asking his friends.

See the Chapati Chart and tell -
- How many children like to get wet in the rain?
(a) Half
(b) One-fourth
(c) Three-fourth - How many children do not like to get wet in the rain?
(a) Half
(b) One-fourth
(c) Three-fourth - If the number of children in the class is 28, then tell the number of children
(a) Who like to get wet in the rain?
(b) Who do not like to get wet in the rain?
| Colour of flowers | Number of flowers |
| Blue | 9 |
| Red | 7 |
| Orange | 5 |
| Purple | 10 |
Draw the right flower. Write how many there are.
 |
 |
 |
 |
______ are more than ______
Answer the following question.
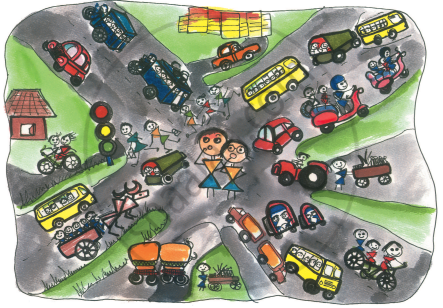
In the picture which way of travel do you see the most?
| Face of the die | Number of times ( / for each throw) |
|
| | | | | |
|
| | | |
|
| | | | | |
|
| | | | |
|
| | | | | | | |
|
| | | | | | |
Compare your table with that of the student sitting next to you. Do you find any difference in the two tables?
What have your classmates brought for lunch today? Find out and note down.
| Food item | Number of students |
| Absent Students' Chart | |
| Class | Absent student |
| Class I |   |
| Class II |  |
| Class III |    |
| Class IV |     |
| Class V |   |
Now look at the chart and fill in the blanks:
The class with the highest number of absent students is ______.
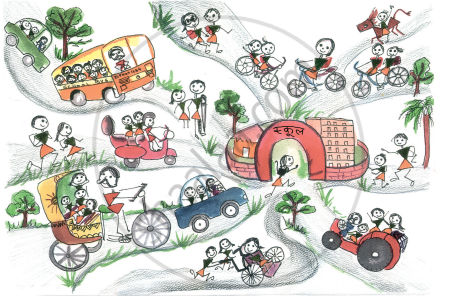
Look at the picture and fill in the table.
| Way of coming | Tractor | ______ | ______ | ______ |
| Number of students | 3 | ______ | ______ | ______ |
| Bird | Sparrow | Crow | Parrot | Peacock | Hen |
| Colours | 2 | 1 | 2 | 10 | 4 |
Which bird has the most colours?
