Advertisements
Advertisements
प्रश्न
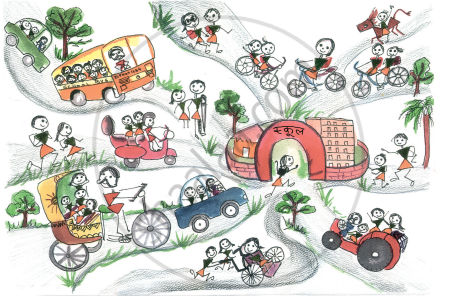
Look at the picture and fill in the table.
| Way of coming | Tractor | ______ | ______ | ______ |
| Number of students | 3 | ______ | ______ | ______ |
सारिणी
Advertisements
उत्तर
| Way of coming | Tractor | Bicycle | Walking | Car | Rickshaw |
| Number of students | 3 | 5 | 11 | 4 | 4 |
shaalaa.com
Smart Charts
क्या इस प्रश्न या उत्तर में कोई त्रुटि है?
APPEARS IN
संबंधित प्रश्न
Read the poem carefully and answer these questions.
- Which word comes most often in the poem?
- Which letter has been used most?
- Which letter comes the least?
Some children were asked which of these they liked most-Tea, Coffee or Milk.
| The Drink they like | Number of children |
| Milk | 20 |
| Coffee | 10 |
| Tea | 10 |
- Total number of children ______
- Children who like milk are `1/2`/ `1/4` of the total children.
- Children who like coffee are `1/2`/`1/4` of the total children.
- Show the liking for Tea, Coffee or Milk in a Chapati Chart.
Look at the traffic scene in the picture and fill in the table.
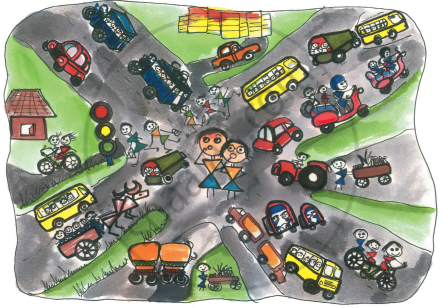
| Way of Travel | How many |
| Walking (people) | |
| Bicycles | |
| Scooters | |
| Face of the die | Number of times ( / for each throw) |
 |
| | | | | |
 |
| | | |
 |
| | | | | |
 |
| | | | |
 |
| | | | | | | |
 |
| | | | | | |
Which face of the die did you get the most number of times?
Talk to people around you about their favourite sweets. Fill in the table:
| Favourite sweet | Number of people |
| Jalebi | |
| Favourite sweet | Number of people |
| Jalebi | 20 |
| Rasgulla | 18 |
| Jamun | 25 |
| Laddoo | 22 |
| Burfi | 17 |
| Kalakand | 15 |
Least favourite sweet ______
| Favourite sweet | Number of people |
| Jalebi | 20 |
| Rasgulla | 18 |
| Jamun | 25 |
| Laddoo | 22 |
| Burfi | 17 |
| Kalakand | 15 |
______ is liked more than ______
| Food item | Number of students |
| Lemon rice | 7 |
| Meals | 12 |
| Curd rice | 5 |
| Fried rice | 3 |
| Tomato rice | 2 |
Food item brought for lunch by the biggest number of students ______.
| Absent Students' Chart | |
| Class | Absent student |
| Class I |   |
| Class II |  |
| Class III |    |
| Class IV |     |
| Class V |   |
Now look at the chart and fill in the blanks:
The class with the highest number of absent students is ______.
| Absent Students' Chart | |
| Class | Absent student |
| Class I | |
| Class II | |
| Class III | |
| Class IV | |
| Class V | |
Now look at the chart and fill in the blanks:
The number of students absent in Class IV and Class V are ______ and ______.
