Advertisements
Advertisements
प्रश्न
Look at the traffic scene in the picture and fill in the table.
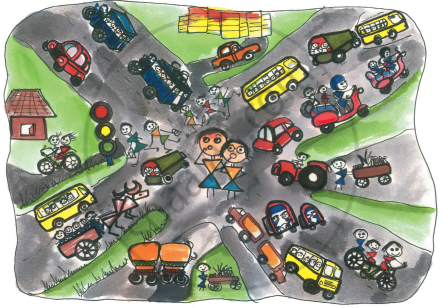
| Way of Travel | How many |
| Walking (people) | |
| Bicycles | |
| Scooters | |
सारिणी
Advertisements
उत्तर
| Way of Travel | How many |
| Walking (people) | 9 |
| Bicycles | 5 |
| Scooters | 2 |
| Trucks | 2 |
| Buses | 4 |
| Bullock-cart | 1 |
shaalaa.com
Smart Charts
क्या इस प्रश्न या उत्तर में कोई त्रुटि है?
APPEARS IN
संबंधित प्रश्न
How much time do we spend in this?
 |
 |
 |
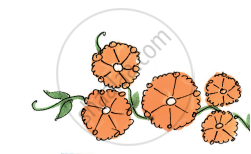 |
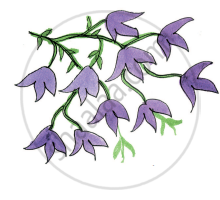
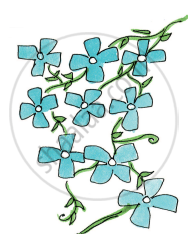
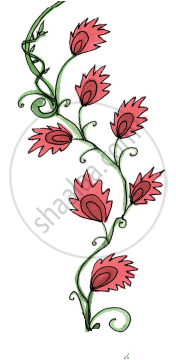
| Colour of flowers | Number of flowers |
| Blue | 9 |
| Red | 7 |
| Orange | 5 |
| Purple | 10 |
Draw the right flower. Write how many there are.
______ are the most in number. How many?
Answer the following question.

Answer the following question.
Which way of travel (vehicle) do you see the least?
| Face of the die | Number of times ( / for each throw) |
 |
| | | | | |
 |
| | | |
 |
| | | | | |
 |
| | | | |
 |
| | | | | | | |
 |
| | | | | | |
How many times did come up? ______ times
| Food item | Number of students |
| Lemon rice | 7 |
| Meals | 12 |
| Curd rice | 5 |
| Fried rice | 3 |
| Tomato rice | 2 |
Food item brought by the smallest number of students ______
| Food item | Number of students |
| Lemon rice | 7 |
| Meals | 12 |
| Curd rice | 5 |
| Fried rice | 3 |
| Tomato rice | 2 |
Food item brought for lunch by the biggest number of students ______.
| Number of people living together | How many families |
| 1 alone | 2 |
| 2 people | 5 |
| 3 people | 8 |
| 4 people | 6 |
| 5 people | 4 |
| 6 people | 2 |
| 7 people | 2 |
| 8 people | 1 |
Most families have ______ people living in their homes.
| Absent Students' Chart | |
| Class | Absent student |
| Class I |   |
| Class II |  |
| Class III |    |
| Class IV |     |
| Class V |   |
Now look at the chart and fill in the blanks:
The class with the least number of absent students is ______.
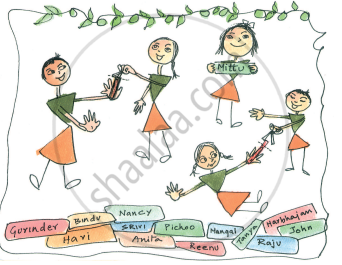
- Make a group of 4 friends.
- Cut strips from waste paper. The strips should be of the same width.
- Measure the length of each student's hand with the paper strip. Cut the strip and write the name of the student.
| Vegetable disliked | Number of students |
| Onion | 2 |
| Tomato | 3 |
| Brinjal | 4 |
| Ladyfinger | 2 |
| Potato | 1 |
The most disliked vegetable is ______
