Advertisements
Advertisements
प्रश्न
| Favourite sweet | Number of people |
| Jalebi | 20 |
| Rasgulla | 18 |
| Jamun | 25 |
| Laddoo | 22 |
| Burfi | 17 |
| Kalakand | 15 |
विकल्प
Kalakand and Burfi
Laddoo and Jamun
Jamun and Rasgulla
Rasgulla and Jalebi
Advertisements
उत्तर
Jamun is liked more than Rasgulla.
APPEARS IN
संबंधित प्रश्न
How much time do we spend in this?
Find out from your friends the time they spend in a week.
|
How many hours they watch TV or listen to the radio (in a week) |
Number of children |
| More than 6 hours | |
| Six hours | |
| Five hours | |
| Four hours | |
| Three hours | |
| Two hours | |
| One hour | |
| Zero hour (do not watch) |
All children of a school take part in different clubs:
The Chapati Chart shows the number of children in different clubs.

From the picture we can see that:
- Half the children in the class take part in the Games Club.
- One fourth of the children are members of the Garden Club.
- The Drawing Club has one fourth of the children of the class.
If there are 200 students in the school, look at the above Chapati Chart and tell the number of members in each club :
- The Games Club has ______ members.
- The Garden Club has ______ members.
- There are ______ members in the Drawing Club.
Have you been to a park?
| Face of the die | Number of times ( / for each throw) |
 |
| | | | | |
 |
| | | |
 |
| | | | | |
 |
| | | | |
 |
| | | | | | | |
 |
| | | | | | |
came up more number of times than ______.
| Number of people living together | How many families |
| 1 alone | 2 |
| 2 people | 5 |
| 3 people | 8 |
| 4 people | 6 |
| 5 people | 4 |
| 6 people | 2 |
| 7 people | 2 |
| 8 people | 1 |
The least number of people living in a home is ______
Rohan, Jacob and Geeta also measured their hands. They stuck their strips as shown.
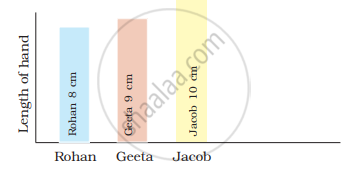
The length of Geeta's hand is ______ than Rohan's hand.
| Bird | Sparrow | Crow | Parrot | Peacock | Hen |
| Colours | 2 | 1 | 2 | 10 | 4 |
Which bird has the most colours?
| Animal | Cow | Buffalo | Dog | Cat | Rabbit |
| Number of people who pet them | 30 | 20 | 50 | 10 | 5 |
Which animal is liked most as a pet?
| Vegetable disliked | Number of students |
| Onion | 2 |
| Tomato | 3 |
| Brinjal | 4 |
| Ladyfinger | 2 |
| Potato | 1 |
The vegetable disliked by very few children is ______.
