Advertisements
Advertisements
प्रश्न
| Face of the die | Number of times ( / for each throw) |
 |
| | | | | |
 |
| | | |
 |
| | | | | |
 |
| | | | |
 |
| | | | | | | |
 |
| | | | | | |
came up more number of times than ______.
विकल्प
Advertisements
उत्तर
came up more number of times than .
APPEARS IN
संबंधित प्रश्न
- Ask people in your family to name one programme they like and one programme they dislike. Make a table.
Family member Programme they like Programme they dislike Mother Father - The kind of programme most family members like ______
- The kind of programme most family members dislike ______
 |
 |
 |
 |
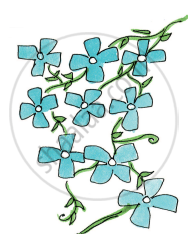
| Colour of flowers | Number of flowers |
| Blue | 9 |
| Red | 7 |
| Orange | 5 |
| Purple | 10 |
Draw the right flower. Write how many there are.
______ are the most in number. How many?
| Colour of flowers | Number of flowers |
| Blue | 9 |
| Red | 7 |
| Orange | 5 |
| Purple | 10 |
Draw the right flower. Write how many there are.
 |
 |
 |
 |
______ are more than ______
| Food item | Number of students |
| Lemon rice | 7 |
| Meals | 12 |
| Curd rice | 5 |
| Fried rice | 3 |
| Tomato rice | 2 |
Food item brought by the smallest number of students ______
| Absent Students' Chart | |
| Class | Absent student |
| Class I |   |
| Class II |  |
| Class III |    |
| Class IV |     |
| Class V |   |
Now look at the chart and fill in the blanks:
The class with 3 students absent is ______.
| Absent Students' Chart | |
| Class | Absent student |
| Class I | |
| Class II | |
| Class III | |
| Class IV | |
| Class V | |
Now look at the chart and fill in the blanks:
The number of students absent in Class IV and Class V are ______ and ______.
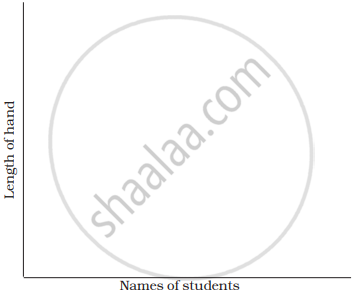
In the chart below stick the strips of all the friends in your group. Keep some space between the strips.

Look at the picture and fill in the table.
| Way of coming | Tractor | ______ | ______ | ______ |
| Number of students | 3 | ______ | ______ | ______ |
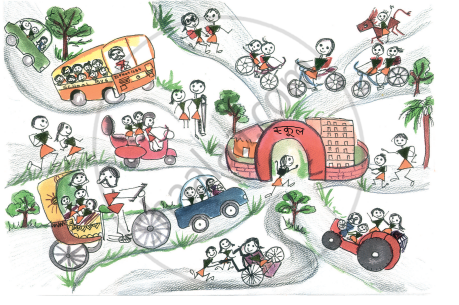 Fill in the blanks:
The number of students walking to school is ______ than the students coming on bicycle.
Make your own smart charts about things around you.
