Advertisements
Advertisements
प्रश्न
Fill in the blanks:
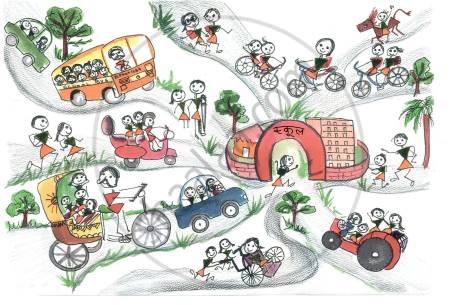
The most number of students come to school by ______.
विकल्प
Tractor
Bicycle
Walking
Car
Advertisements
उत्तर
The most number of students come to school by walking.
APPEARS IN
संबंधित प्रश्न
Note the time you spend in front of a TV or radio every day. Do this for one week.
The time spent in a week is ______ hours.
Find out from your friends the time they spend in a week.
|
How many hours they watch TV or listen to the radio (in a week) |
Number of children |
| More than 6 hours | |
| Six hours | |
| Five hours | |
| Four hours | |
| Three hours | |
| Two hours | |
| One hour | |
| Zero hour (do not watch) |
Find out from 20 friends the programmes they like and dislike, and write in a table.
| Kind of programme |
Number of children liking it |
Number of children disliking it |
| News | ||
| Serials | ||
| Cartoons | ||
| Comedy shows | ||
| Sports |
- Which kind of programme is liked by most children?
- Which kind of programme is disliked by the least number of children?
- How many children like sports programmes?
- Is there any kind of programme not liked by anyone? Yes/No. If yes, which one?
 |
 |
 |
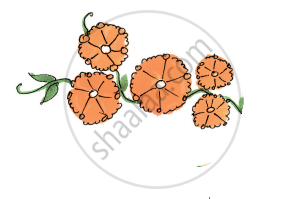 |
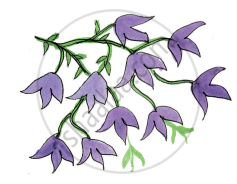
Look at the different flowers in the picture. Complete the table:
| Colour of flowers | Number of flowers |
| Blue | |
| Red | |
| Orange | |
| Purple |
| Colour of flowers | Number of flowers |
| Blue | 9 |
| Red | 7 |
| Orange | 5 |
| Purple | 10 |
Draw the right flower. Write how many there are.
 |
 |
 |
 |
______ are more than ______
Rabia threw her die 30 times. She got  five times. In her table she marked:
Now fill in the table:
| Face of the die | Number of times ( / for each throw) |
 |
|
 |
|
 |
|
 |
|
 |
|
 |
| Face of the die | Number of times ( / for each throw) |
|
| | | | | |
|
| | | |
|
| | | | | |
|
| | | | |
|
| | | | | | | |
|
| | | | | | |
How many times did come up? ______ times
Talk to people around you about their favourite sweets. Fill in the table:
| Favourite sweet | Number of people |
| Jalebi | |
What have your classmates brought for lunch today? Find out and note down.
| Food item | Number of students |
| Vegetable disliked | Number of students |
| Onion | 2 |
| Tomato | 3 |
| Brinjal | 4 |
| Ladyfinger | 2 |
| Potato | 1 |
The most disliked vegetable is ______
