Advertisements
Advertisements
प्रश्न
What coloured flowers did you see?
Advertisements
उत्तर
I saw different colours of flowers – red, blue, yellow, orange, violet, pink, etc.
APPEARS IN
संबंधित प्रश्न
How much time do we spend in this?
- Ask people in your family to name one programme they like and one programme they dislike. Make a table.
Family member Programme they like Programme they dislike Mother Father - The kind of programme most family members like ______
- The kind of programme most family members dislike ______
Take a paragraph you like from your language textbook. Read carefully and find out.
- Which word comes most often? How many times?
- Which word comes least often?
- The letter used most often is ______
- The letter used least often is ______
Have you been to a park?
Were most of the flowers yellow in colour?
 |
 |
 |
 |
| Colour of flowers | Number of flowers |
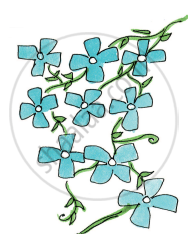
| Blue | 9 |
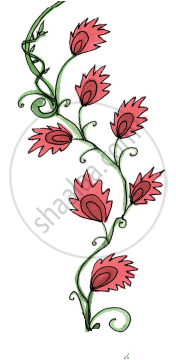
| Red | 7 |
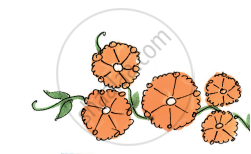
| Orange | 5 |
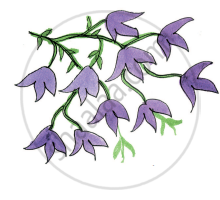
| Purple | 10 |
Draw the right flower. Write how many there are.
______ are the least in number. How many?
Rohan, Jacob and Geeta also measured their hands. They stuck their strips as shown.
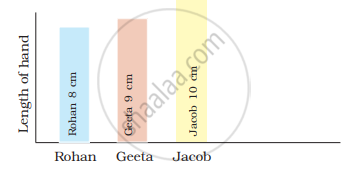
The length of Geeta's hand is ______ than Rohan's hand.
Rohan, Jacob and Geeta also measured their hands. They stuck their strips as shown.
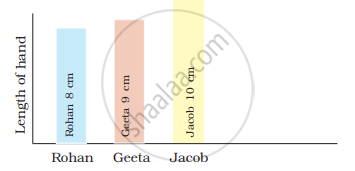
Look at the picture and fill in the blanks:
______ has the shortest hand.
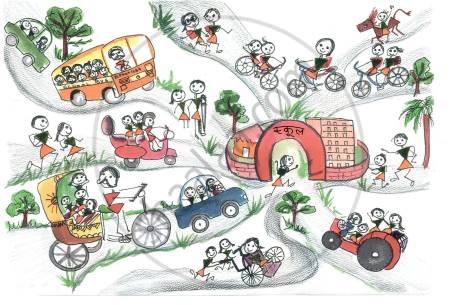
Fill in the blanks:
The most number of students come to school by ______.
| Bird | Sparrow | Crow | Parrot | Peacock | Hen |
| Colours | 2 | 1 | 2 | 10 | 4 |
Which bird has the most colours?
