Advertisements
Advertisements
Question
The time taken, in seconds, to solve a problem for each of 25 persons is as follows:
| 16 | 20 | 26 | 27 | 28 |
| 30 | 33 | 37 | 38 | 40 |
| 42 | 43 | 46 | 46 | 47 |
| 48 | 49 | 50 | 53 | 58 |
| 59 | 60 | 64 | 52 | 20 |
(i) Construct a frequency distribution for these data using a class interval of 10 seconds.
(ii) In a school the weekly pocket money of 50 students is as follow's:
| Weekly pocket money (₹) | No. of student |
| 40 - 50 | 2 |
| 59 - 60 | 8 |
| 60 - 70 | 12 |
| 70 - 80 | 14 |
| 80 - 90 | 8 |
| 90 - 100 | 6 |
Draw a histogram and a frequency polygon on the same graph. Find mode from the graph.
Advertisements
Solution
(i) Frequency table
| Time (in seconds) |
Tally marks | Frequency |
| 10 - 20 | I | 1 |
| 20 - 30 | IIIII | 5 |
| 30 - 40 | I I I I | 4 |
| 40 - 50 | IIII I I I I | 8 |
| 50 - 60 | IIIII | 5 |
| 60 - 70 | I I | 2 |
Histogram representing the time taken in seconds, to solve. A problem for each of 25 persons.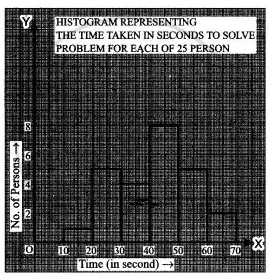
(ii) Frequency distribution table is
| Weekly pocket money (in ₹) | Class Marks | No. of Students |
| 40 - 50 | 45 | 2 |
| 50 - 60 | 55 | 8 |
| 60 - 70 | 65 | 12 |
| 70 - 80 | 75 | 14 |
| 80 - 90 | 85 | 8 |
| 90 - 100 | 95 | 6 |
Draw the histogram and frequency polygon on the graph.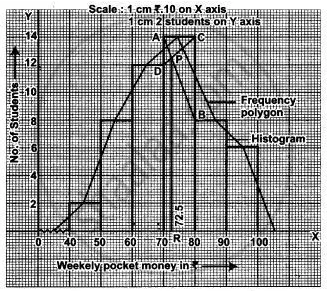
Now, in the highest rectangle, draw two straight line AB and CD from the corners of the rectangle on either sides of the highest rectangle to opposite corners of the highest rectangle. They intersect P. Draw PR X-axis, then abscissa of the point prepresents ₹ 72·5.
Hence, the required mode is ₹72·5.
RELATED QUESTIONS
Given below is the frequency distribution of driving speeds (in km/hour) of the vehicles of 400 college students:
| Speed (in km/hr) | No. of Students |
| 20-30 | 6 |
| 30-40 | 80 |
| 40-50 | 156 |
| 50-60 | 98 |
60-70 |
60 |
Draw Histogram and hence the frequency polygon for the above data.
Draw histogram for the following frequency distributions:
| Class Interval | 0 – 10 | 10 – 20 | 20 – 30 | 30 – 40 | 40 – 50 | 50 – 60 |
| Frequency | 12 | 20 | 26 | 18 | 10 | 6 |
Draw histogram for the following frequency distributions:
| Class Interval | 10 – 16 | 16 – 22 | 22 – 28 | 28 – 34 | 34 – 40 |
| Frequency | 15 | 23 | 30 | 20 | 16 |
| Electricity bill (₹) | 0 - 200 | 200 - 400 | 400 - 600 | 600 - 800 | 800 - 1000 |
| Families | 240 | 300 | 450 | 350 | 160 |
Find the lower quartile, the upper quartile, the interquartile range and the semi-interquartile range for the following frequency distributions:
| Shoe size | 5 | 6 | 7 | 8 | 9 | 10 | 11 |
| Frequency | 8 | 1 | 7 | 14 | 11 | 5 | 4 |
Construct histograms for following frequency distribution:
| Class Interval | 1-10 | 11-20 | 21-30 | 31-40 | 41-50 |
| Frequency | 11 | 23 | 30 | 20 | 16 |
Identify the following data can be represented in a histogram?
The number of mountain climbers in the age group 20 to 60 in Tamil Nadu.
In a village, there are 570 people who have cell phones. An NGO survey their cell phone usage. Based on this survey a histogram is drawn
How many people use the cell phone for less than 3 hours?
Look at the histogram below and answer the questions that follow.

- How many students have height more than or equal to 135 cm but less than 150 cm?
- Which class interval has the least number of students?
- What is the class size?
- How many students have height less than 140 cm?
The following histogram shows the frequency distribution of teaching experiences of 30 teachers in various schools:

- What is the class width?
- How many teachers are having the maximum teaching experience and how many have the least teaching experience?
- How many teachers have teaching experience of 10 to 20 years?
