Advertisements
Advertisements
प्रश्न
The time taken, in seconds, to solve a problem for each of 25 persons is as follows:
| 16 | 20 | 26 | 27 | 28 |
| 30 | 33 | 37 | 38 | 40 |
| 42 | 43 | 46 | 46 | 47 |
| 48 | 49 | 50 | 53 | 58 |
| 59 | 60 | 64 | 52 | 20 |
(i) Construct a frequency distribution for these data using a class interval of 10 seconds.
(ii) In a school the weekly pocket money of 50 students is as follow's:
| Weekly pocket money (₹) | No. of student |
| 40 - 50 | 2 |
| 59 - 60 | 8 |
| 60 - 70 | 12 |
| 70 - 80 | 14 |
| 80 - 90 | 8 |
| 90 - 100 | 6 |
Draw a histogram and a frequency polygon on the same graph. Find mode from the graph.
Advertisements
उत्तर
(i) Frequency table
| Time (in seconds) |
Tally marks | Frequency |
| 10 - 20 | I | 1 |
| 20 - 30 | IIIII | 5 |
| 30 - 40 | I I I I | 4 |
| 40 - 50 | IIII I I I I | 8 |
| 50 - 60 | IIIII | 5 |
| 60 - 70 | I I | 2 |
Histogram representing the time taken in seconds, to solve. A problem for each of 25 persons.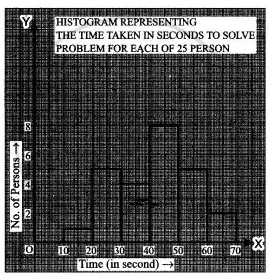
(ii) Frequency distribution table is
| Weekly pocket money (in ₹) | Class Marks | No. of Students |
| 40 - 50 | 45 | 2 |
| 50 - 60 | 55 | 8 |
| 60 - 70 | 65 | 12 |
| 70 - 80 | 75 | 14 |
| 80 - 90 | 85 | 8 |
| 90 - 100 | 95 | 6 |
Draw the histogram and frequency polygon on the graph.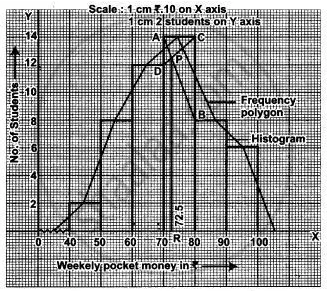
Now, in the highest rectangle, draw two straight line AB and CD from the corners of the rectangle on either sides of the highest rectangle to opposite corners of the highest rectangle. They intersect P. Draw PR X-axis, then abscissa of the point prepresents ₹ 72·5.
Hence, the required mode is ₹72·5.
संबंधित प्रश्न
The following is the frequency distribution of waiting time at ATM centre; draw histogram to represent the data:
| Waiting time (in seconds) |
Number of Customers |
| 0 -30 | 15 |
| 30 - 60 | 23 |
| 60 - 90 | 64 |
| 90 - 120 | 50 |
| 120 - 150 | 5 |
The following table is based on the marks of the first term examination of 10th class students. Show the information by a histogram. Also, draw a frequency polygon with the help of the histogram.
| Class-mark of marks | 325 | 375 | 425 | 475 | 525 | 575 |
| No. of students | 25 | 35 | 45 | 40 | 32 | 20 |
Find the lower quartile, the upper quartile, the interquartile range and the semi-interquartile range for the following frequency distributions:
| Marks | 25 | 30 | 35 | 40 | 45 | 50 |
| No. of students | 6 | 15 | 12 | 10 | 18 | 9 |
Construct histograms for following frequency distribution:
| Class Mark | 15 | 25 | 35 | 45 | 50 | 55 | 60 |
| Frenuencv | 6 | 12 | 15 | 18 | 25 | 14 | 10 |
Represent the following data by histogram:
| Price of sugar Per kg (in Rs) | Number of weeks |
| 28-30 | 4 |
| 30-32 | 8 |
| 32-34 | 22 |
| 34-36 | 12 |
| 36-38 | 6 |
Following table present educational level (middle stage) of females in Arunachal pradesh according to 1981 census:
| Age group | Number of females (to the nearest ten) |
| 10 - 14 | 300 |
| 15 - 19 | 980 |
| 20 - 24 | 800 |
| 25 - 29 | 380 |
| 30 - 34 | 290 |
Draw a histogram to represent the above data.
In a village, there are 570 people who have cell phones. An NGO survey their cell phone usage. Based on this survey a histogram is drawn
How many people use the cell phone for less than 3 hours?
Draw a histogram for the following data.
| Class Interval | 0 − 10 | 10 − 20 | 20 − 30 | 30 − 40 | 40 − 50 | 50 − 60 |
| No. of students | 5 | 15 | 23 | 20 | 10 | 7 |
Draw a histogram to represent the frequency distribution in question 91.
Use graph paper for this question. Estimate the mode of the given distribution by plotting a histogram. [Take 2 cm = 10 marks along one axis and 2 cm = 5 students along the other axis]
| Daily wages (in ₹) | 30 - 40 | 40 - 50 | 50 - 60 | 60 - 70 | 70 - 80 |
| No. of Workers | 6 | 12 | 20 | 15 | 9 |
