Advertisements
Advertisements
प्रश्न
The time taken, in seconds, to solve a problem for each of 25 persons is as follows:
| 16 | 20 | 26 | 27 | 28 |
| 30 | 33 | 37 | 38 | 40 |
| 42 | 43 | 46 | 46 | 47 |
| 48 | 49 | 50 | 53 | 58 |
| 59 | 60 | 64 | 52 | 20 |
(i) Construct a frequency distribution for these data using a class interval of 10 seconds.
(ii) In a school the weekly pocket money of 50 students is as follow's:
| Weekly pocket money (₹) | No. of student |
| 40 - 50 | 2 |
| 59 - 60 | 8 |
| 60 - 70 | 12 |
| 70 - 80 | 14 |
| 80 - 90 | 8 |
| 90 - 100 | 6 |
Draw a histogram and a frequency polygon on the same graph. Find mode from the graph.
Advertisements
उत्तर
(i) Frequency table
| Time (in seconds) |
Tally marks | Frequency |
| 10 - 20 | I | 1 |
| 20 - 30 | IIIII | 5 |
| 30 - 40 | I I I I | 4 |
| 40 - 50 | IIII I I I I | 8 |
| 50 - 60 | IIIII | 5 |
| 60 - 70 | I I | 2 |
Histogram representing the time taken in seconds, to solve. A problem for each of 25 persons.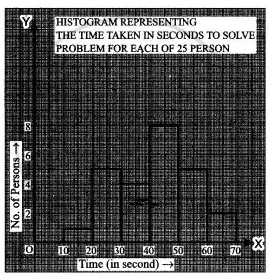
(ii) Frequency distribution table is
| Weekly pocket money (in ₹) | Class Marks | No. of Students |
| 40 - 50 | 45 | 2 |
| 50 - 60 | 55 | 8 |
| 60 - 70 | 65 | 12 |
| 70 - 80 | 75 | 14 |
| 80 - 90 | 85 | 8 |
| 90 - 100 | 95 | 6 |
Draw the histogram and frequency polygon on the graph.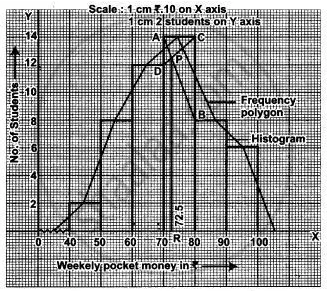
Now, in the highest rectangle, draw two straight line AB and CD from the corners of the rectangle on either sides of the highest rectangle to opposite corners of the highest rectangle. They intersect P. Draw PR X-axis, then abscissa of the point prepresents ₹ 72·5.
Hence, the required mode is ₹72·5.
संबंधित प्रश्न
The shoppers who come to a departmental store are marked as: man (M), woman (W), boy (B) or girl (G). The following list gives the shoppers who came during the first hour in the morning
W W W G B W W M G G M M W W W W G B M W B G G M W W M M W W W M W B W G M W W W W G W M M W W M W G W M G W M M B G G W
Make a frequency distribution table using tally marks. Draw a bar graph to illustrate it.
The histogram below represents the scores obtained by 25 students in a mathematics mental test. Use the data to:
- Frame a frequency distribution table.
- To calculate mean.
- To determine the Modal class.

Observe the following frequency polygon and write the answers of the questions below it.
- Which class has the maximum number of students?
- Write the classes having zero frequency.
- What is the class-mark of the class, having frequency of 50 students?
- Write the lower and upper class limits of the class whose class mark is 85.
- How many students are in the class 80-90?
Draw a histogram of the following data:
| Class interval: | 10−15 | 15−20 | 20−25 | 25−30 | 30−35 | 34−40 |
| Frequency: | 30 | 98 | 80 | 58 | 29 | 50 |
In a hypothetical sample of 20 people the amounts of money with them were found to be as follows:
114, 108, 100, 98, 101, 109, 117, 119, 126, 131, 136, 143, 156, 169, 182, 195, 207, 219, 235, 118.
Draw the histogram of the frequency distribution (taking one of the class intervals as 50 − 100).
The following frequency distribution table shows marks obtained by 180 students in Mathematics examination.
| Marks | No. of students |
| 0 - 10 | 25 |
| 10 - 20 | x |
| 20 - 30 | 30 |
| 30 - 40 | 2x |
| 40 - 50 | 65 |
Find the value of x. Also draw a histogram representing the above information.
Find the lower quartile, the upper quartile, the interquartile range and the semi-interquartile range for the following frequency distributions:
| Marks | 25 | 30 | 35 | 40 | 45 | 50 |
| No. of students | 6 | 15 | 12 | 10 | 18 | 9 |
Represent the following data by histogram:
| Price of Sugar (per kg in ₹) | Number of Weeks |
| 18 – 20 | 4 |
| 20 – 22 | 8 |
| 22 – 24 | 22 |
| 24 – 26 | 12 |
| 26 – 28 | 6 |
| 28 – 30 | 8 |
In a histogram ______ are drawn with width equal to a class interval without leaving any gap in between.
Draw a histogram to represent the frequency distribution in question 91.
