Advertisements
Advertisements
Question
The number of bottles of cold drinks sold by a shopkeeper on six consecutive days is as follows:
| Day | Sunday | Monday | Tuesday | Wednesday | Thursday | Friday |
| Number of bottles | 350 | 200 | 300 | 250 | 100 | 150 |
Prepare a pictograph of the data using one symbol to represent 50 bottles.
Advertisements
Solution
Let 50 bottles of cold drinks can be represented by ![]() .
.
For Sunday, 350 cold drink bottles can be represented by 7 complete symbols.
For Monday, 200 cold drink bottles can be represented by 4 complete symbols.
For Tuesday, 300 cold drink bottles can be represented by 6 complete symbols.
For Wednesday, 250 cold drink bottles can be represented by 5 complete symbols.
For Thursday, 100 cold drink bottles can be represented by 2 complete symbols.
For Friday, 150 cold drink bottles can be represented by 3 complete symbols.
Hence, the required pictograph of given data is shown below
| Days | Bottles |
| Sunday | 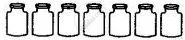 |
| Monday |  |
| Tuesday | 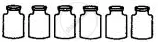 |
| Wednesday | 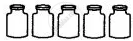 |
| Thursday |  |
| Friday |  |
APPEARS IN
RELATED QUESTIONS
The following pictograph shows the number of cars sold by four dealers A, B, C and D in a city. Scale:  = 50 cars.
| Dealer | Number of cars |
| A |       |
| B |      |
| C |         |
| D |     |
Using the pictograph, drawn above, answer the following questions:
What is the total number of cars sold by all the dealers?
The following pictograph shows different subject books which are kept in a school library.
| Subject | Number of books |
| Hindi |       |
| English |       |
| Math |      |
| Science |      |
| History |     |
Taking symbol of one book = 50 books, find:
How many Science books are there in the library?
A Pictograph is also known as _____________
Mr. Dinesh collected the information about the rainfall of a particular city in a week from the newspaper and recorded his information in the pictograph.
| Millimeters of Rain | |
| Sunday |  |
| Monday |  |
| Tuesday |  |
| Wednesday |  |
| Thursday |  |
| Friday |  |
| Saturday |  |

a. On which day, the rain was most?
b. On which day, the rain was least?
c. How much rain was there on Sunday?
d. How much rain was there on Monday?
e. Find total rainfall of the city in that week?
A ______ represents data through pictures of objects.
Students of Class VI in a school were given a task to count the number of articles made of different materials in the school.
The information collected by them is represented as follows:
| Material used | Articles |
| Wood |  |
| Glass |  |
| Metal |  |
| Rubber |  |
| Plastic |  |
Observe the pictograph and answer the following questions:
- Which material is used in maximum number of articles?
- Which material is used in minimum number of articles?
- Which material is used in exactly half the number of articles as those made up of metal?
- What is the total number of articles counted by the students?
The number of scouts in a school is depicted by the following pictograph:
| Class | Number of scouts |
| VI |  |
| VII |  |
| VIII |  |
| IX |  |
| X |  |
Observe the pictograph and answer the following questions:
- Which class has the minimum number of scouts?
- Which class has the maximum number of scouts?
- How many scouts are there in Class VI?
- Which class has exactly four times the scouts as that of Class X?
- What is the total number of scouts in the Classes VI to X?
A survey was carried out in a certain school to find out the popular school subjects among students of Classes VI to VIII.
The data in this regard is displayed as pictograph given below:
| Subject | Number of Students |
| Hindi | |
| English | |
| Mathematics | |
| Science | |
| Social Studies |
- Which subject is most popular among the students?
- How many students like Mathematics?
- Find the number of students who like subjects other than Mathematics and Science.
Prepare a pictograph of the information given in the question.
Scale: 1 unit length = 10 tickets
What is a pictograph
