Advertisements
Advertisements
प्रश्न
The number of bottles of cold drinks sold by a shopkeeper on six consecutive days is as follows:
| Day | Sunday | Monday | Tuesday | Wednesday | Thursday | Friday |
| Number of bottles | 350 | 200 | 300 | 250 | 100 | 150 |
Prepare a pictograph of the data using one symbol to represent 50 bottles.
Advertisements
उत्तर
Let 50 bottles of cold drinks can be represented by ![]() .
.
For Sunday, 350 cold drink bottles can be represented by 7 complete symbols.
For Monday, 200 cold drink bottles can be represented by 4 complete symbols.
For Tuesday, 300 cold drink bottles can be represented by 6 complete symbols.
For Wednesday, 250 cold drink bottles can be represented by 5 complete symbols.
For Thursday, 100 cold drink bottles can be represented by 2 complete symbols.
For Friday, 150 cold drink bottles can be represented by 3 complete symbols.
Hence, the required pictograph of given data is shown below
| Days | Bottles |
| Sunday | 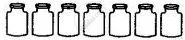 |
| Monday | 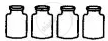 |
| Tuesday | 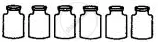 |
| Wednesday | 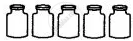 |
| Thursday |  |
| Friday |  |
APPEARS IN
संबंधित प्रश्न
The following pictograph shows the number of watches manufactured by a factory, in a particular weeks.
| Day | Number of watches |
| Monday |       |
| Tuesday |            |
| Wednesday |       |
| Thursday |       |
| Friday |      |
| Saturday |         |
Scale:  = 100 watches
Find the total number of watches manufactured in the whole week?
The number of animals in five villages are as follows:
| Village | A | B | C | D | E |
| No. of. animals | 160 | 240 | 180 | 80 | 120 |
Prepare a pictograph of these animals using one symbol to represent 20 animals.
The following pictograph shows different subject books which are kept in a school library.
| Subject | Number of books |
| Hindi |       |
| English |       |
| Math |      |
| Science |      |
| History |     |
Taking symbol of one book = 50 books, find:
How many History books are there in the library?
The following pictograph shows different subject books which are kept in a school library.
| Subject | Number of books |
| Hindi | |
| English | |
| Math | |
| Science | |
| History | |
Taking symbol of one book = 50 books, find:
Which books are maximum in number?
Representation of data by using pictures is known as ______________
The representation of ‘one picture to many objects’ in a Pictograph is called ____________
A ______ represents data through pictures of objects.
In a pictograph, if a symbol ![]() represents 20 flowers in a basket then
represents 20 flowers in a basket then ![]() stands for ______ flowers.
stands for ______ flowers.
On the scale of 1 unit length = 10 crore, the bar of length 6 units will represent ______ crore and of ______ units will represent 75 crore.
The following table gives information about the circulation of newspapers (dailies) in a town in five languages.
| Language | English | Hindi | Tamil | Punjabi | Gujarati |
| Number of newspapers |
5000 | 8500 | 500 | 2500 | 1000 |
Prepare a pictograph of the above data, using a symbol of your choice, each representing 1000 newspapers.
