Advertisements
Advertisements
Question
Sketch the graphs showing variation of stopping potential with frequency of incident radiations for two photosensitive materials A and B having threshold frequencies vA > vB.
(i) In which case is the stopping potential more and why?
(ii) Does the slope of the graph depend on the nature of the material used? Explain.
Advertisements
Solution
(i)
Graph between stopping potential and the frequency of the incident radiation:
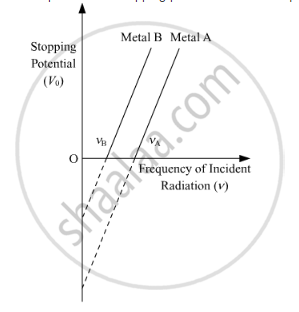
From the graph, we note:
(i) The stopping potential is inversely proportional to the threshold frequency. Hence the stopping potential is higher for metal B.
(ii) The slope of the graph does not depend on the nature of the material used.
As we know,
Kmax= hv − ϕ0 = eV0
Dividing the whole equation by e , we get
`(hv)/e-phi_0/e=V_0`
From the above equation, the slope of the graph is `h/e`(on comparing with the straight line equation). Thus, we see that the slope is independent of the nature of the photoelectric material.
APPEARS IN
RELATED QUESTIONS
The photoelectric work function for a metal is 4.2 eV. If the stopping potential is 3V, find the threshold wavelength and maximum kinetic energy of emitted electrons.
(Velocity of light in air = 3 x 10⁸m/s,
Planck's constant = 6·63 x10-34 J -s,
Charg.e ori electron = 1·6 x 10 -19 C)
Draw a plot showing the variation of photoelectric current versus the intensity of incident radiation on a given photosensitive surface.
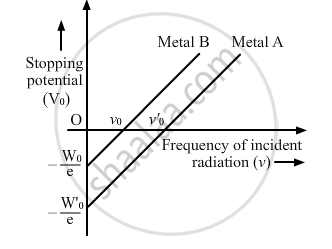
The graph shows the variation of stopping potential with frequency of incident radiation for two photosensitive metals A and B. Which one of the two has higher value of work-function? Justify your answer.
Draw a plot showing the variation of photoelectric current with collector potential for different frequencies but same intensity of incident radiation ?
Use Einstein's photoelectric equation to explain the observations from this graph ?
Draw a plot showing the variation of photoelectric current with collector plate potential for two different frequencies, v1 > v2, of incident radiation having the same intensity. In which case will the stopping potential be higher? Justify your answer.
Calculate the momentum of a photon of energy 6 x I 0-19 J.
Plot a labelled graph of IVsl where Vs is stopping potential versus frequency f of the incident radiation.
If the frequency of the incident radiation is increased from 4 × 10¹⁵ Hz to 8 × 10¹⁵ Hz, by how much will the stopping potential for a given photosensitive surface go up?
Consider an electron in front of metallic surface at a distance d (treated as an infinite plane surface). Assume the force of attraction by the plate is given as `1/4 q^2/(4πε_0d^2)`. Calculate work in taking the charge to an infinite distance from the plate. Taking d = 0.1 nm, find the work done in electron volts. [Such a force law is not valid for d < 0.1nm].
