Advertisements
Advertisements
Question
Draw a plot showing the variation of photoelectric current with collector plate potential for two different frequencies, v1 > v2, of incident radiation having the same intensity. In which case will the stopping potential be higher? Justify your answer.
Advertisements
Solution
Effect of frequency of the incident radiation:
Taking radiations of different frequencies but of same intensity, the variation between photoelectric current and potential of plate A is obtained and shown in graph given below:

From the graph, we note:
(i) The value of stopping potential is different for radiation of different frequency.
(ii) The value of stopping potential is more negative for radiation of higher incident frequency.
(iii) The value of saturation current depends on the intensity of incident radiation, but is independent of the frequency of the incident radiation.
APPEARS IN
RELATED QUESTIONS
Draw a neat labelled circuit diagram of experimental arrangement for study of photoelectric effect.
If the total energy of radiation of frequency 1014 Hz is 6.63 J, calculate the number of photons in the radiation. (Planck’s constant = 6.63 x 10⁻³⁴ J.s.)
In an experiment of the photoelectric effect, the graph of maximum kinetic energy EK of the emitted photoelectrons versus the frequency v of the incident light is a straight line AB shown in Figure 6 below:
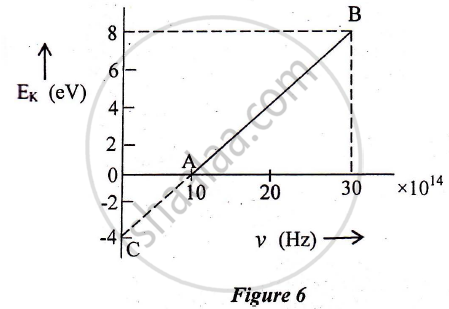
Find:
1) Threshold frequency of the metal
2) The work function of the metal.
3) Stopping potential for the photoelectrons emitted by the light of frequency `v = 30 xx 10^14 Hz`
A photosensitive surface emits photoelectrons when red light falls on it. Will the surface emit photoelectrons when blue light is incident on it? Give reason.
A beam of monochromatic radiation is incident on a photosensitive surface. Answer the following question giving reason :
On what factors does the number of emitted photoelectrons depend?
Two metals A and B have work functions 4 eV and 6 eV respectively. Which metal has a lower threshold wavelength for photoelectric effect?
What happened to high-voltage sparks across the detector loop when the emitter plate was illuminated with ultraviolet light from an arc lamp?
What are the free, charged particles that escape from the metal surface?
Where are the electrons that absorb energy from incident radiation located?
What must electrons near the metal surface overcome before they can escape?
