Advertisements
Advertisements
Question
In an experiment of the photoelectric effect, the graph of maximum kinetic energy EK of the emitted photoelectrons versus the frequency v of the incident light is a straight line AB shown in Figure 6 below:
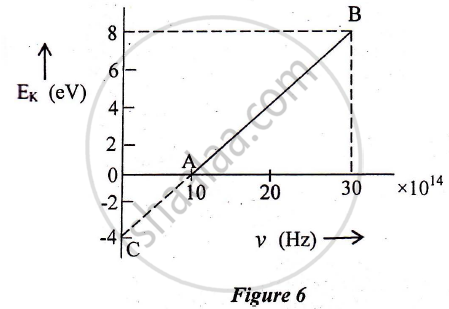
Find:
1) Threshold frequency of the metal
2) The work function of the metal.
3) Stopping potential for the photoelectrons emitted by the light of frequency `v = 30 xx 10^14 Hz`
Advertisements
Solution
1) From the graph,
Threshold frequency = `10 xx 10^14 Hz`
`v_0 = 10^15 Hz`
2) The work function of the metal
`w = hv_0`
`= 6.63 xx 10^(-34) xx 15^15`
`= (6.63 xx 10^(-19))/(1.6 xx 10^(-19))`
= 4.14 eV
3) `E_k = 8 eV`
Stopping potential = `K.E._"max" - phi`
`=> 8 - 4.14 = 3.86 eV`
`V = 3.86/e xx ev = 3.86 V`
APPEARS IN
RELATED QUESTIONS
The photoelectric work function for a metal surface is 2.3 eV. If the light of wavelength 6800A is incident on the surface of metal, find threshold frequency and incident frequency. Will there be an emission of photoelectrons or not?
[Velocity of light c = 3 x 10⁸ m/s,
Planck’s constant, h = 6.63 * 10-34 Js ]
The photoelectric current in a photoelectric cell can be reduced to zero by a stopping potential of 1.8 volt. Monochromatic light of wavelength 2200Å is incident on the cathode. Find the maximum kinetic energy of the photoelectrons in joules. [Charge on electron = 1.6 x 10⁻¹⁹ C]
Two monochromatic beams, one red and the other blue, have the same intensity. In which case (i) the number of photons per unit area per second is larger, (ii) the maximum kinetic energy of the photoelectrons is more? Justify your answer.
Draw a plot showing the variation of photoelectric current with collector potential for different frequencies but same intensity of incident radiation ?
Draw a plot showing the variation of photoelectric current with collector plate potential for two different frequencies, v1 > v2, of incident radiation having the same intensity. In which case will the stopping potential be higher? Justify your answer.
State how will you use this graph to detennine the value of Planck's constant.
Who discovered the phenomenon of photoelectric emission?
In what year was the phenomenon of photoelectric emission discovered?
During which experiments did Heinrich Hertz observe photoelectric emission?
What are the free, charged particles that escape from the metal surface?
