Advertisements
Advertisements
Question
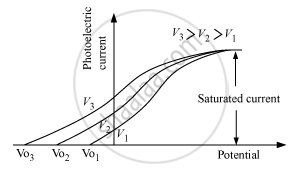
Draw a plot showing the variation of photoelectric current with collector potential for different frequencies but same intensity of incident radiation ?
Advertisements
Solution
Plot showing the variation of photoelectric current with collector potential for different frequencies but same intensity of incident radiation
APPEARS IN
RELATED QUESTIONS
Draw a neat labelled circuit diagram of experimental arrangement for study of photoelectric effect.
Write three characteristic features in photoelectric effect that cannot be explained on the basis of wave theory of light, but can be explained only using Einstein's equation.
The photoelectric work function for a metal is 4.2 eV. If the stopping potential is 3V, find the threshold wavelength and maximum kinetic energy of emitted electrons.
(Velocity of light in air = 3 x 10⁸m/s,
Planck's constant = 6·63 x10-34 J -s,
Charg.e ori electron = 1·6 x 10 -19 C)
Light of intensity ‘I’ and frequency ‘v’ is incident on a photosensitive surface and causes photoelectric emission. What will be the effect on anode current when the anode potential is increased? In each case, all other factors remain the same. Explain, giving justification in each case.
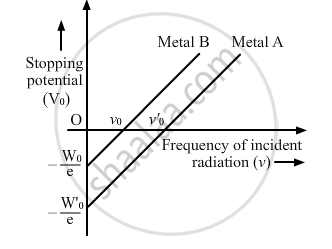
The graph shows the variation of stopping potential with frequency of incident radiation for two photosensitive metals A and B. Which one of the two has higher value of work-function? Justify your answer.
A photosensitive surface emits photoelectrons when red light falls on it. Will the surface emit photoelectrons when blue light is incident on it? Give reason.
A beam of monochromatic radiation is incident on a photosensitive surface. Answer the following question giving reason :
Does the kinetic energy of the emitted electrons depend on the intensity of incident radiation?
A beam of monochromatic radiation is incident on a photosensitive surface. Answer the following question giving reason :
On what factors does the number of emitted photoelectrons depend?
Draw a plot showing the variation of photoelectric current with collector plate potential for two different frequencies, v1 > v2, of incident radiation having the same intensity. In which case will the stopping potential be higher? Justify your answer.
Light of wavelength 4000 Å is incident on two metals A and B. Which metal will emit photoelectrons, if their work functions are 3.8 e V and 1.6 e V respectively?
