Advertisements
Advertisements
प्रश्न
In an experiment of the photoelectric effect, the graph of maximum kinetic energy EK of the emitted photoelectrons versus the frequency v of the incident light is a straight line AB shown in Figure 6 below:
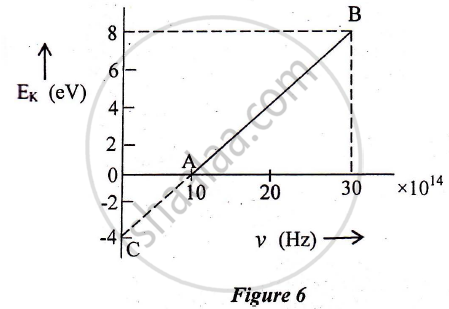
Find:
1) Threshold frequency of the metal
2) The work function of the metal.
3) Stopping potential for the photoelectrons emitted by the light of frequency `v = 30 xx 10^14 Hz`
Advertisements
उत्तर
1) From the graph,
Threshold frequency = `10 xx 10^14 Hz`
`v_0 = 10^15 Hz`
2) The work function of the metal
`w = hv_0`
`= 6.63 xx 10^(-34) xx 15^15`
`= (6.63 xx 10^(-19))/(1.6 xx 10^(-19))`
= 4.14 eV
3) `E_k = 8 eV`
Stopping potential = `K.E._"max" - phi`
`=> 8 - 4.14 = 3.86 eV`
`V = 3.86/e xx ev = 3.86 V`
shaalaa.com
क्या इस प्रश्न या उत्तर में कोई त्रुटि है?
