Advertisements
Advertisements
प्रश्न
Sketch the graphs showing variation of stopping potential with frequency of incident radiations for two photosensitive materials A and B having threshold frequencies vA > vB.
(i) In which case is the stopping potential more and why?
(ii) Does the slope of the graph depend on the nature of the material used? Explain.
Advertisements
उत्तर
(i)
Graph between stopping potential and the frequency of the incident radiation:
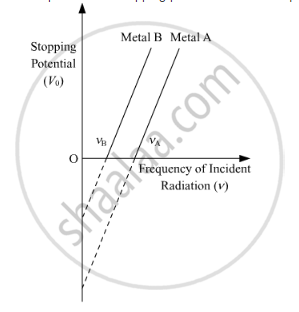
From the graph, we note:
(i) The stopping potential is inversely proportional to the threshold frequency. Hence the stopping potential is higher for metal B.
(ii) The slope of the graph does not depend on the nature of the material used.
As we know,
Kmax= hv − ϕ0 = eV0
Dividing the whole equation by e , we get
`(hv)/e-phi_0/e=V_0`
From the above equation, the slope of the graph is `h/e`(on comparing with the straight line equation). Thus, we see that the slope is independent of the nature of the photoelectric material.
APPEARS IN
संबंधित प्रश्न
The photoelectric work function for a metal surface is 2.3 eV. If the light of wavelength 6800A is incident on the surface of metal, find threshold frequency and incident frequency. Will there be an emission of photoelectrons or not?
[Velocity of light c = 3 x 10⁸ m/s,
Planck’s constant, h = 6.63 * 10-34 Js ]
Light of intensity ‘I’ and frequency ‘v’ is incident on a photosensitive surface and causes photoelectric emission. What will be the effect on anode current when the anode potential is increased? In each case, all other factors remain the same. Explain, giving justification in each case.
The work functions for potassium and caesium are 2.25 eV and 2.14 eV respectively. Is the photoelectric effect possible for either of them if the incident wavelength is 5180 Å?
[Given : Planck’s constant = 6.63 x 10⁻³⁴ J.s.;
Velocity of light = 3 x 10⁸ m/s; 1 eV = 1.6 x 10⁻¹⁹ J]
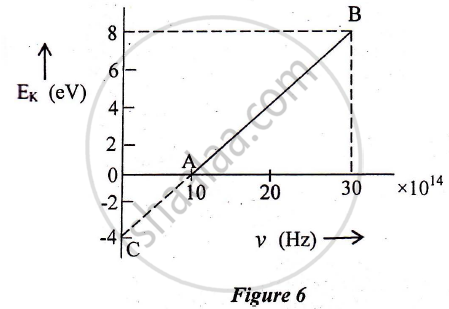
In an experiment of the photoelectric effect, the graph of maximum kinetic energy EK of the emitted photoelectrons versus the frequency v of the incident light is a straight line AB shown in Figure 6 below:
Find:
1) Threshold frequency of the metal
2) The work function of the metal.
3) Stopping potential for the photoelectrons emitted by the light of frequency `v = 30 xx 10^14 Hz`
Draw a plot showing the variation of photoelectric current with collector potential for different frequencies but same intensity of incident radiation ?
What change will you observe if intensity of incident radiation is changed but the frequency remains the same?
What is photoelectri effect ? Defin (i) Stopping potential (ii) Photoelectric work function.
Light of wavelength 4000 Å is incident on two metals A and B. Which metal will emit photoelectrons, if their work functions are 3.8 e V and 1.6 e V respectively?
The phenomenon of photoelectric emission was observed by ______.
In Hertz’s experimental investigation, how were electromagnetic waves produced?
