Advertisements
Advertisements
Question
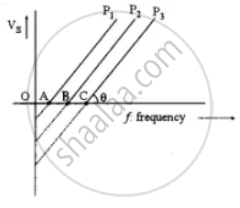
Plot a labelled graph of IVsl where Vs is stopping potential versus frequency f of the incident radiation.
Advertisements
Solution
APPEARS IN
RELATED QUESTIONS
Write three characteristic features in photoelectric effect that cannot be explained on the basis of wave theory of light, but can be explained only using Einstein's equation.
Light of intensity ‘I’ and frequency ‘v’ is incident on a photosensitive surface and causes photoelectric emission. What will be the effect on anode current when the anode potential is increased? In each case, all other factors remain the same. Explain, giving justification in each case.
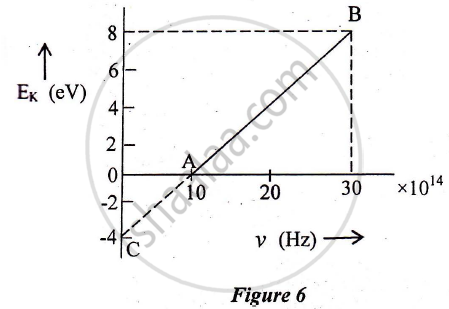
In an experiment of the photoelectric effect, the graph of maximum kinetic energy EK of the emitted photoelectrons versus the frequency v of the incident light is a straight line AB shown in Figure 6 below:
Find:
1) Threshold frequency of the metal
2) The work function of the metal.
3) Stopping potential for the photoelectrons emitted by the light of frequency `v = 30 xx 10^14 Hz`
Draw a plot showing the variation of photoelectric current with collector plate potential for two different frequencies, v1 > v2, of incident radiation having the same intensity. In which case will the stopping potential be higher? Justify your answer.
If the frequency of the incident radiation is increased from 4 × 10¹⁵ Hz to 8 × 10¹⁵ Hz, by how much will the stopping potential for a given photosensitive surface go up?
What happens when light falling on a material (usually a metal) causes photoelectric emission?
In what year was the phenomenon of photoelectric emission discovered?
In Hertz’s experimental investigation, how were electromagnetic waves produced?
What happened to high-voltage sparks across the detector loop when the emitter plate was illuminated with ultraviolet light from an arc lamp?
What must electrons near the metal surface overcome before they can escape?
