Advertisements
Advertisements
Question
Plot the following points and write the name of the figure obtained by joining them in order:
P(– 3, 2), Q(– 7, – 3), R(6, – 3), S(2, 2)
Advertisements
Solution
Let X’ OX and Y’ OY be the coordinate axes and mark point on it. Here, point P(– 3, 2) lies in II quadrant, Q(– 7, – 3) lies in III quadrant, R(6, – 3) lies in IV quadrant and S(2, 2) lies in I quadrant. Plotting the points on the graph paper, the figure obtained is trapezium PQRS.

APPEARS IN
RELATED QUESTIONS
Plot the following point on the graph paper:
(4, −3)
Plot the following point on the graph paper:
(7, −4)
Plot the following point on the graph paper:
(−3, 2)
Write down the abscissa and ordinate of the following.
Q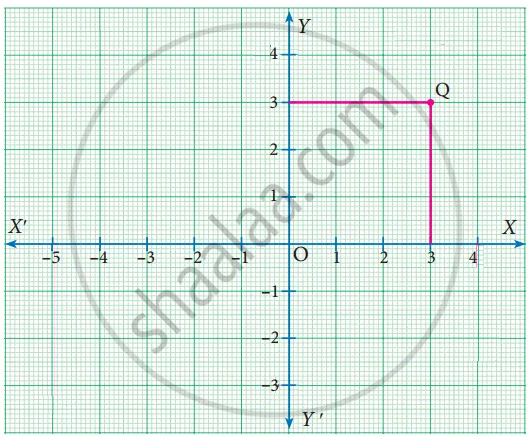
Plot the following point in a graph sheet.
B(−7, −3)
Find the quadrants without plotting the point on a graph sheet.
(5, 7)
Plot the following point in a graph sheet.
K(0, 7)
Use the graph to determine the coordinates where each figure is located.
| a) Star | _______ |
| b) Bird | _______ |
| c) Red circle | _______ |
| d) Diamond | _______ |
| e) Triangle | _______ |
| f) Ant | _______ |
| g) Mango | _______ |
| h) Housefly | _______ |
| i) Medal | _______ |
| j) Spider | _______ |
Write the coordinates of each of the points P, Q, R, S, T and O from the figure.
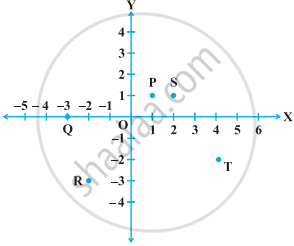
From the figure, answer the following:
- Write the points whose abscissa is 0.
- Write the points whose ordinate is 0.
- Write the points whose abscissa is –5.

