Advertisements
Advertisements
Question
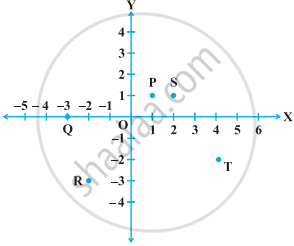
Write the coordinates of each of the points P, Q, R, S, T and O from the figure.
Advertisements
Solution
Here, points P and S lie in I quadrant so their both coordinates will be positive. Now, perpendicular distance of P from both axes is 1, so coordinates of P are (1, 1). Also, perpendicular distance of S from X-axis is 1 and from Y-axis is 2, so coordinates of S are (2, 1).
Point Q lies on X-axis in negative direction so its y-coordinate will be zero and x-coordinate will be –3. So, coordinates of Q are (–3, 0).
Point R lies in III quadrant, so its both coordinates will be negative. Now, its perpendicular distance from X-axis is 3 and from Y-axis is 2, so coordinates of point R are (–2, –3).
Point T lies in IV quadrant, so its x-coordinate will be positive and y-coordinate will be negative. Now, its perpendicular distance from X-axis is 2 and from Y-axis is 4, so coordinates of T are (4, –2). Point O is the intersection of both axes, so it is the origin and its coordinates are O(0, 0).
APPEARS IN
RELATED QUESTIONS
Plot the following point on the graph paper:
(0, 0)
Plot the following point in the coordinate system and identify the quadrant.
P(−7, 6)
Write down the abscissa and ordinate of the following.
R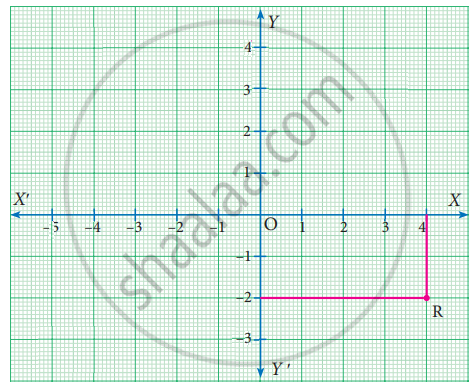
Plot the following points in the coordinate plane. Join them in order. What type of geometrical shape is formed?
(−3, 3) (2, 3) (−6, −1) (5, −1)
On plotting the points O(0, 0), A(3, 0), B(3, 4), C(0, 4) and joining OA, AB, BC and CO which of the following figure is obtained?
If P(−1, 1), Q(3, −4), R(1, −1), S(−2, −3) and T(−4, 4) are plotted on a graph paper, then the points in the fourth quadrant are __________
Plot the following point in a graph sheet.
A(5, 2)
Plot the following point in a graph sheet.
F(2, 0)
Find the quadrants without plotting the point on a graph sheet.
(−9, 50)
Plot the following point in a graph sheet.
J(8, −4)
