Advertisements
Advertisements
Question
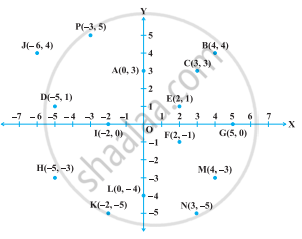
Plot the points (x, y) given by the following table:
| x | 2 | 4 | – 3 | – 2 | 3 | 0 |
| y | 4 | 2 | 0 | 5 | – 3 | 0 |
Advertisements
Solution
On plotting the given points on the graph, we get the points P(2, 4), Q(4, 2), R(–3, 0), S(–2, 5), T(3, – 3) and O(0, 0)

APPEARS IN
RELATED QUESTIONS
Plot the following point on the graph paper:
(0, −4)
Plot the following point in the coordinate system and identify the quadrant.
P(−7, 6)
Plot the following point in the coordinate system and identify the quadrant.
R(−6, −7)
Plot the following point in the coordinate system and identify the quadrant.
S(3, 5)
Plot the following points in the coordinate plane. Join them in order. What type of geometrical shape is formed?
(−3, 3) (2, 3) (−6, −1) (5, −1)
Plot the following point in a graph sheet.
K(0, 7)
Plot the following points and check whether they are collinear or not:
(1, 3), (– 1, – 1), (– 2, – 3)
Which of the following points lie on y-axis?
A(1, 1), B(1, 0), C(0, 1), D(0, 0), E(0, – 1), F(– 1, 0), G(0, 5), H(– 7, 0), I(3, 3).
Plot the points (x, y) given by the following table. Use scale 1 cm = 0.25 units
| x | 1.25 | 0.25 | 1.5 | – 1.75 |
| y | – 0.5 | 1 | 1.5 | – 0.25 |
From the figure, answer the following:
Write the points whose ordinate is 0.